Death Cross: What It Is and How to Read It
Learn what a death cross is, how to spot it on charts, and how to use this technical analysis signal for better risk management.
A death cross is when a stock's 50-day moving average drops below its 200-day moving average. That's it. It signals that recent price action is weaker than longer-term trends.
The Basics
Moving averages explained: A 50-day moving average is the average closing price over the last 50 trading days. The 200-day is the same thing over 200 days. When the shorter average crosses below the longer one, it means recent prices are lower than the longer-term average.
Why it matters: Many institutional traders and algorithms use these crossovers as signals. When a death cross forms, it can trigger selling pressure because systems are programmed to react to it.
What it looks like:
- Before: 50-day MA above 200-day MA (uptrend)
- During: 50-day MA crosses below 200-day MA (the death cross)
- After: 50-day MA stays below 200-day MA (downtrend confirmed)
Visual Examples: Three Time Frames
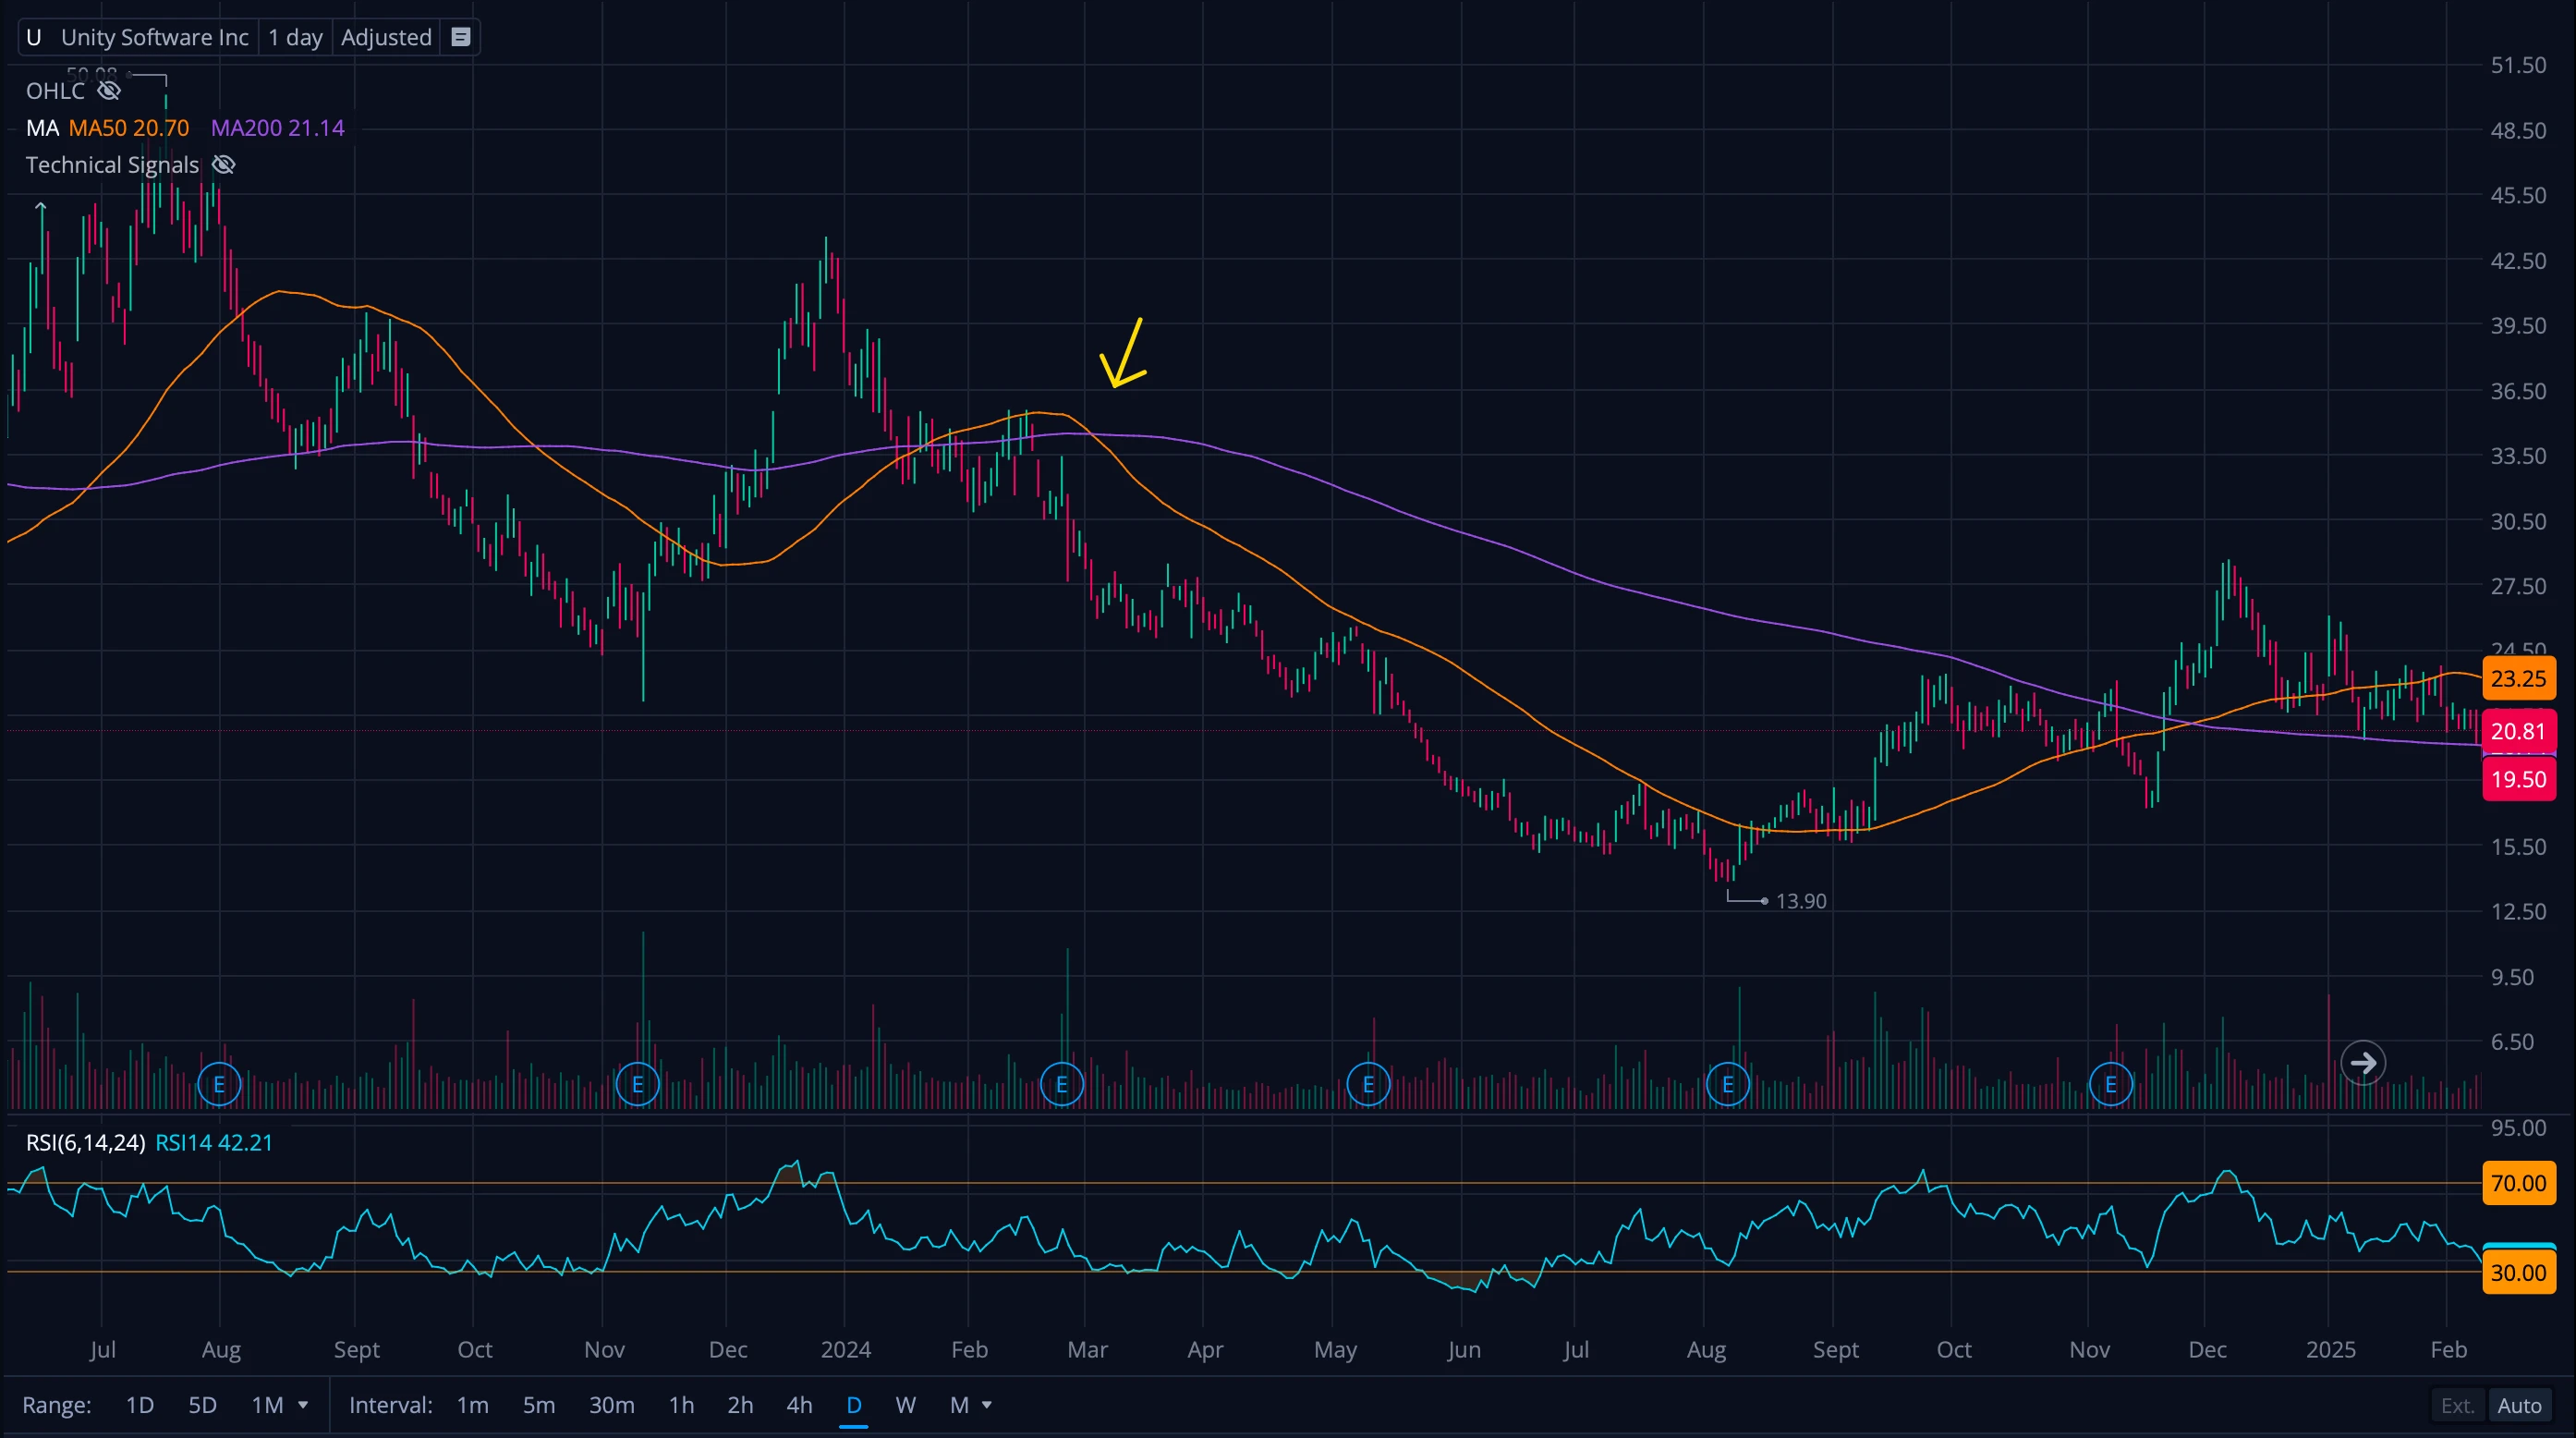
Daily Charts (Short-term perspective)
Daily chart death crosses happen frequently and signal short-term weakness lasting weeks to months. They're useful for active traders but can give false signals.
What to look for:
- Volume increase when the cross happens
- Price staying below both moving averages after the cross
- Overall market direction
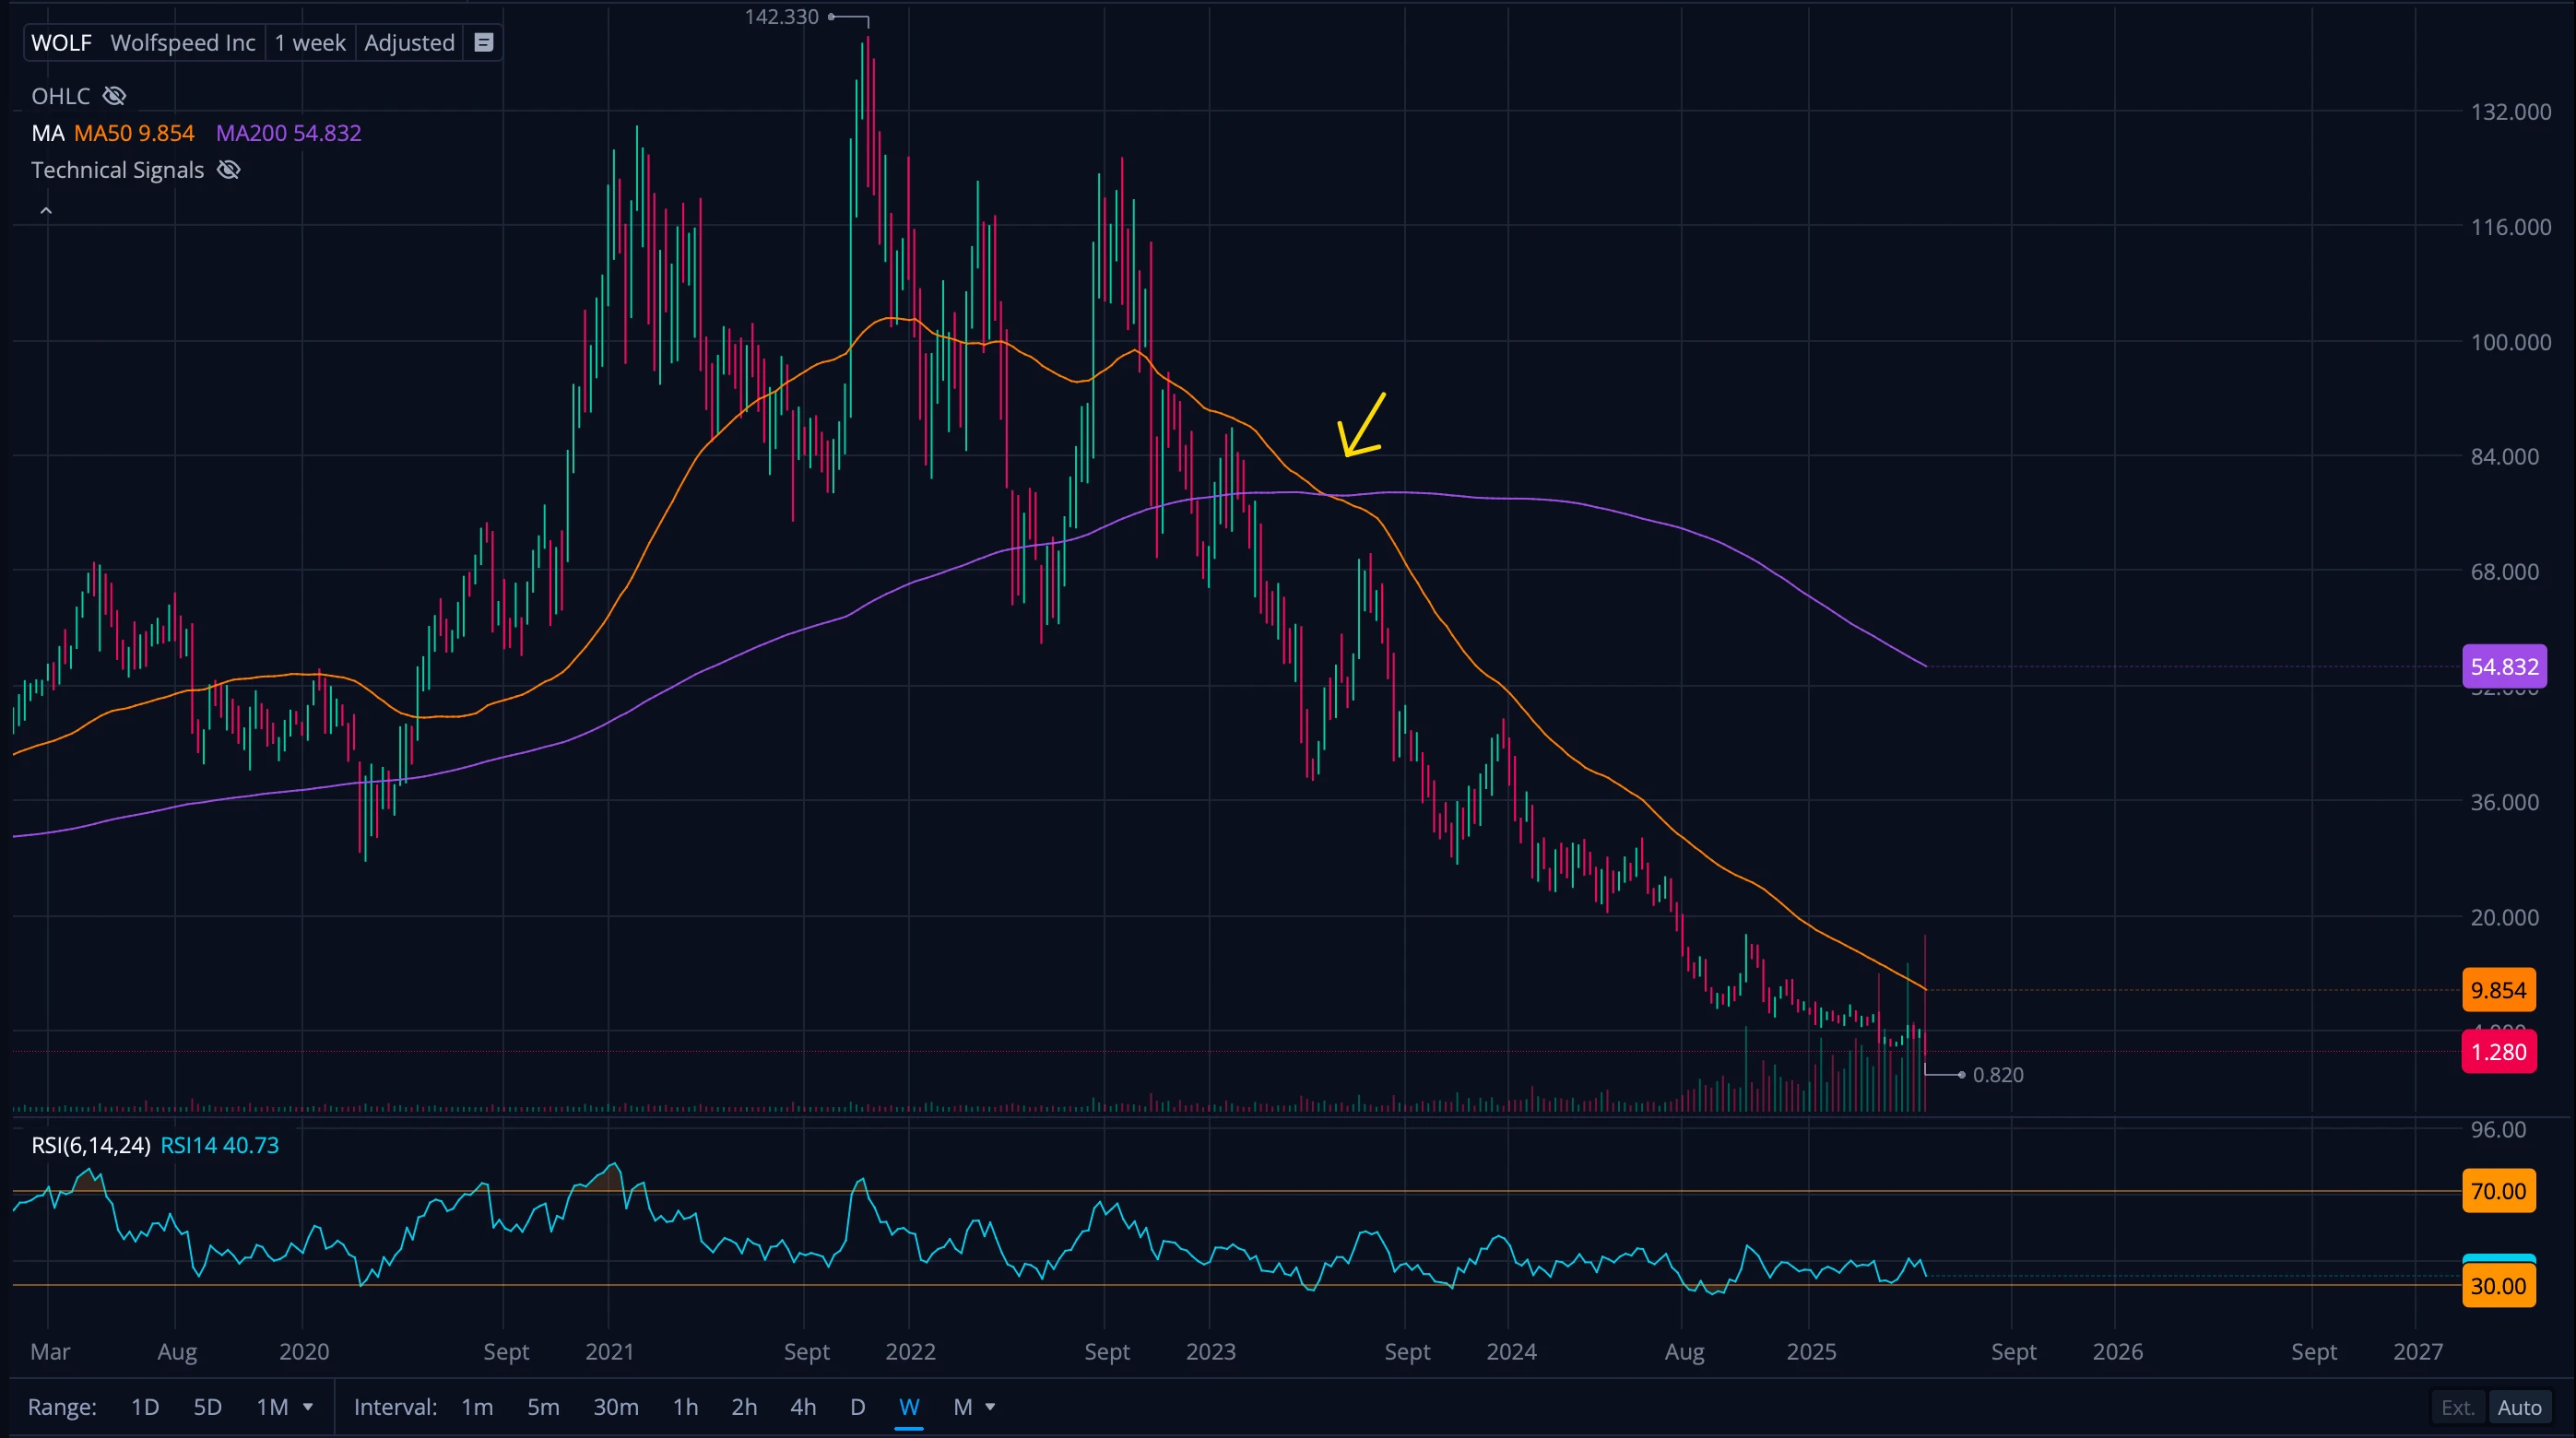
Weekly Charts (Medium-term perspective)
Weekly death crosses are more reliable than daily ones. They typically signal intermediate weakness lasting several months. These matter more for position traders and longer-term holders.
Key points:
- Usually happen after multiple daily death crosses
- Take longer to reverse
- More reliable for trend identification
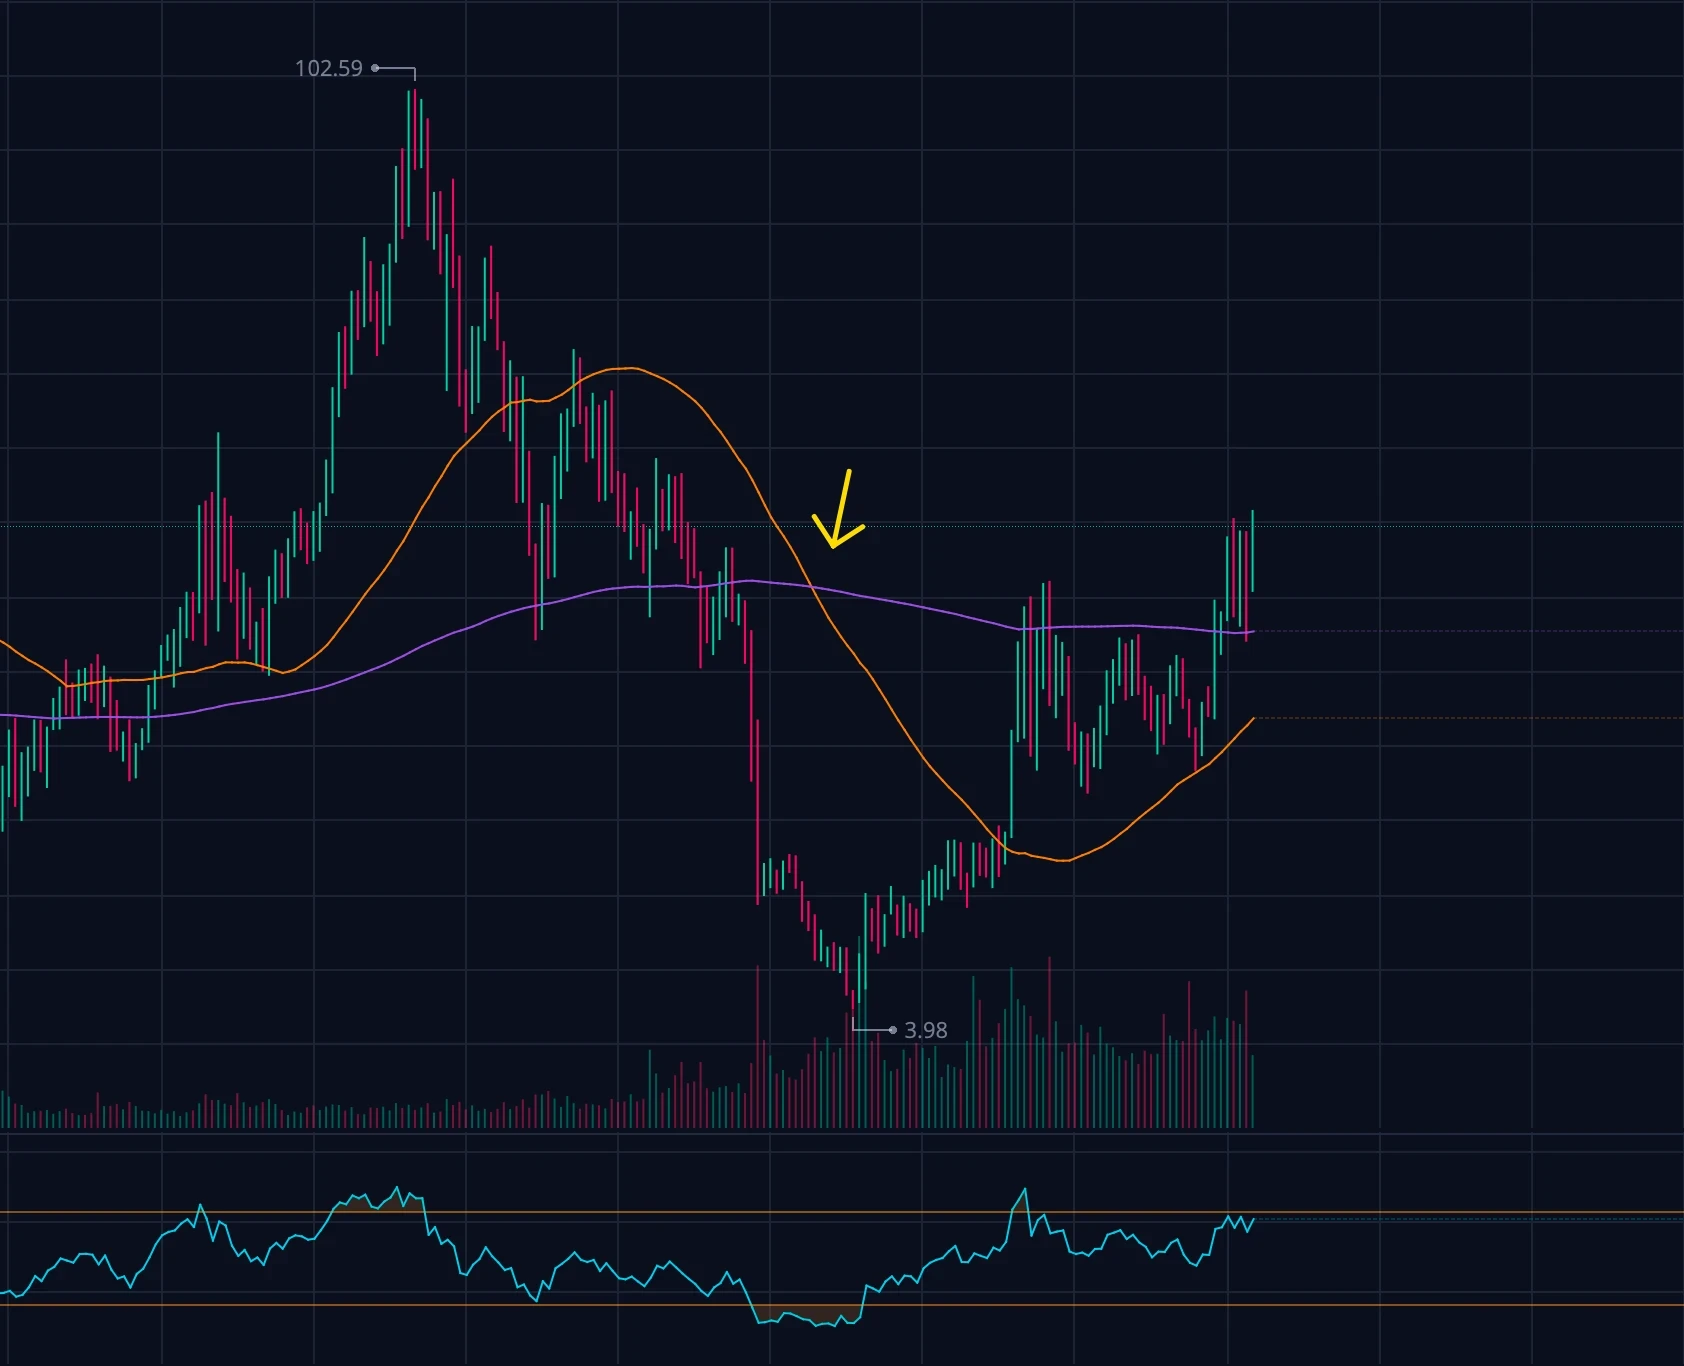
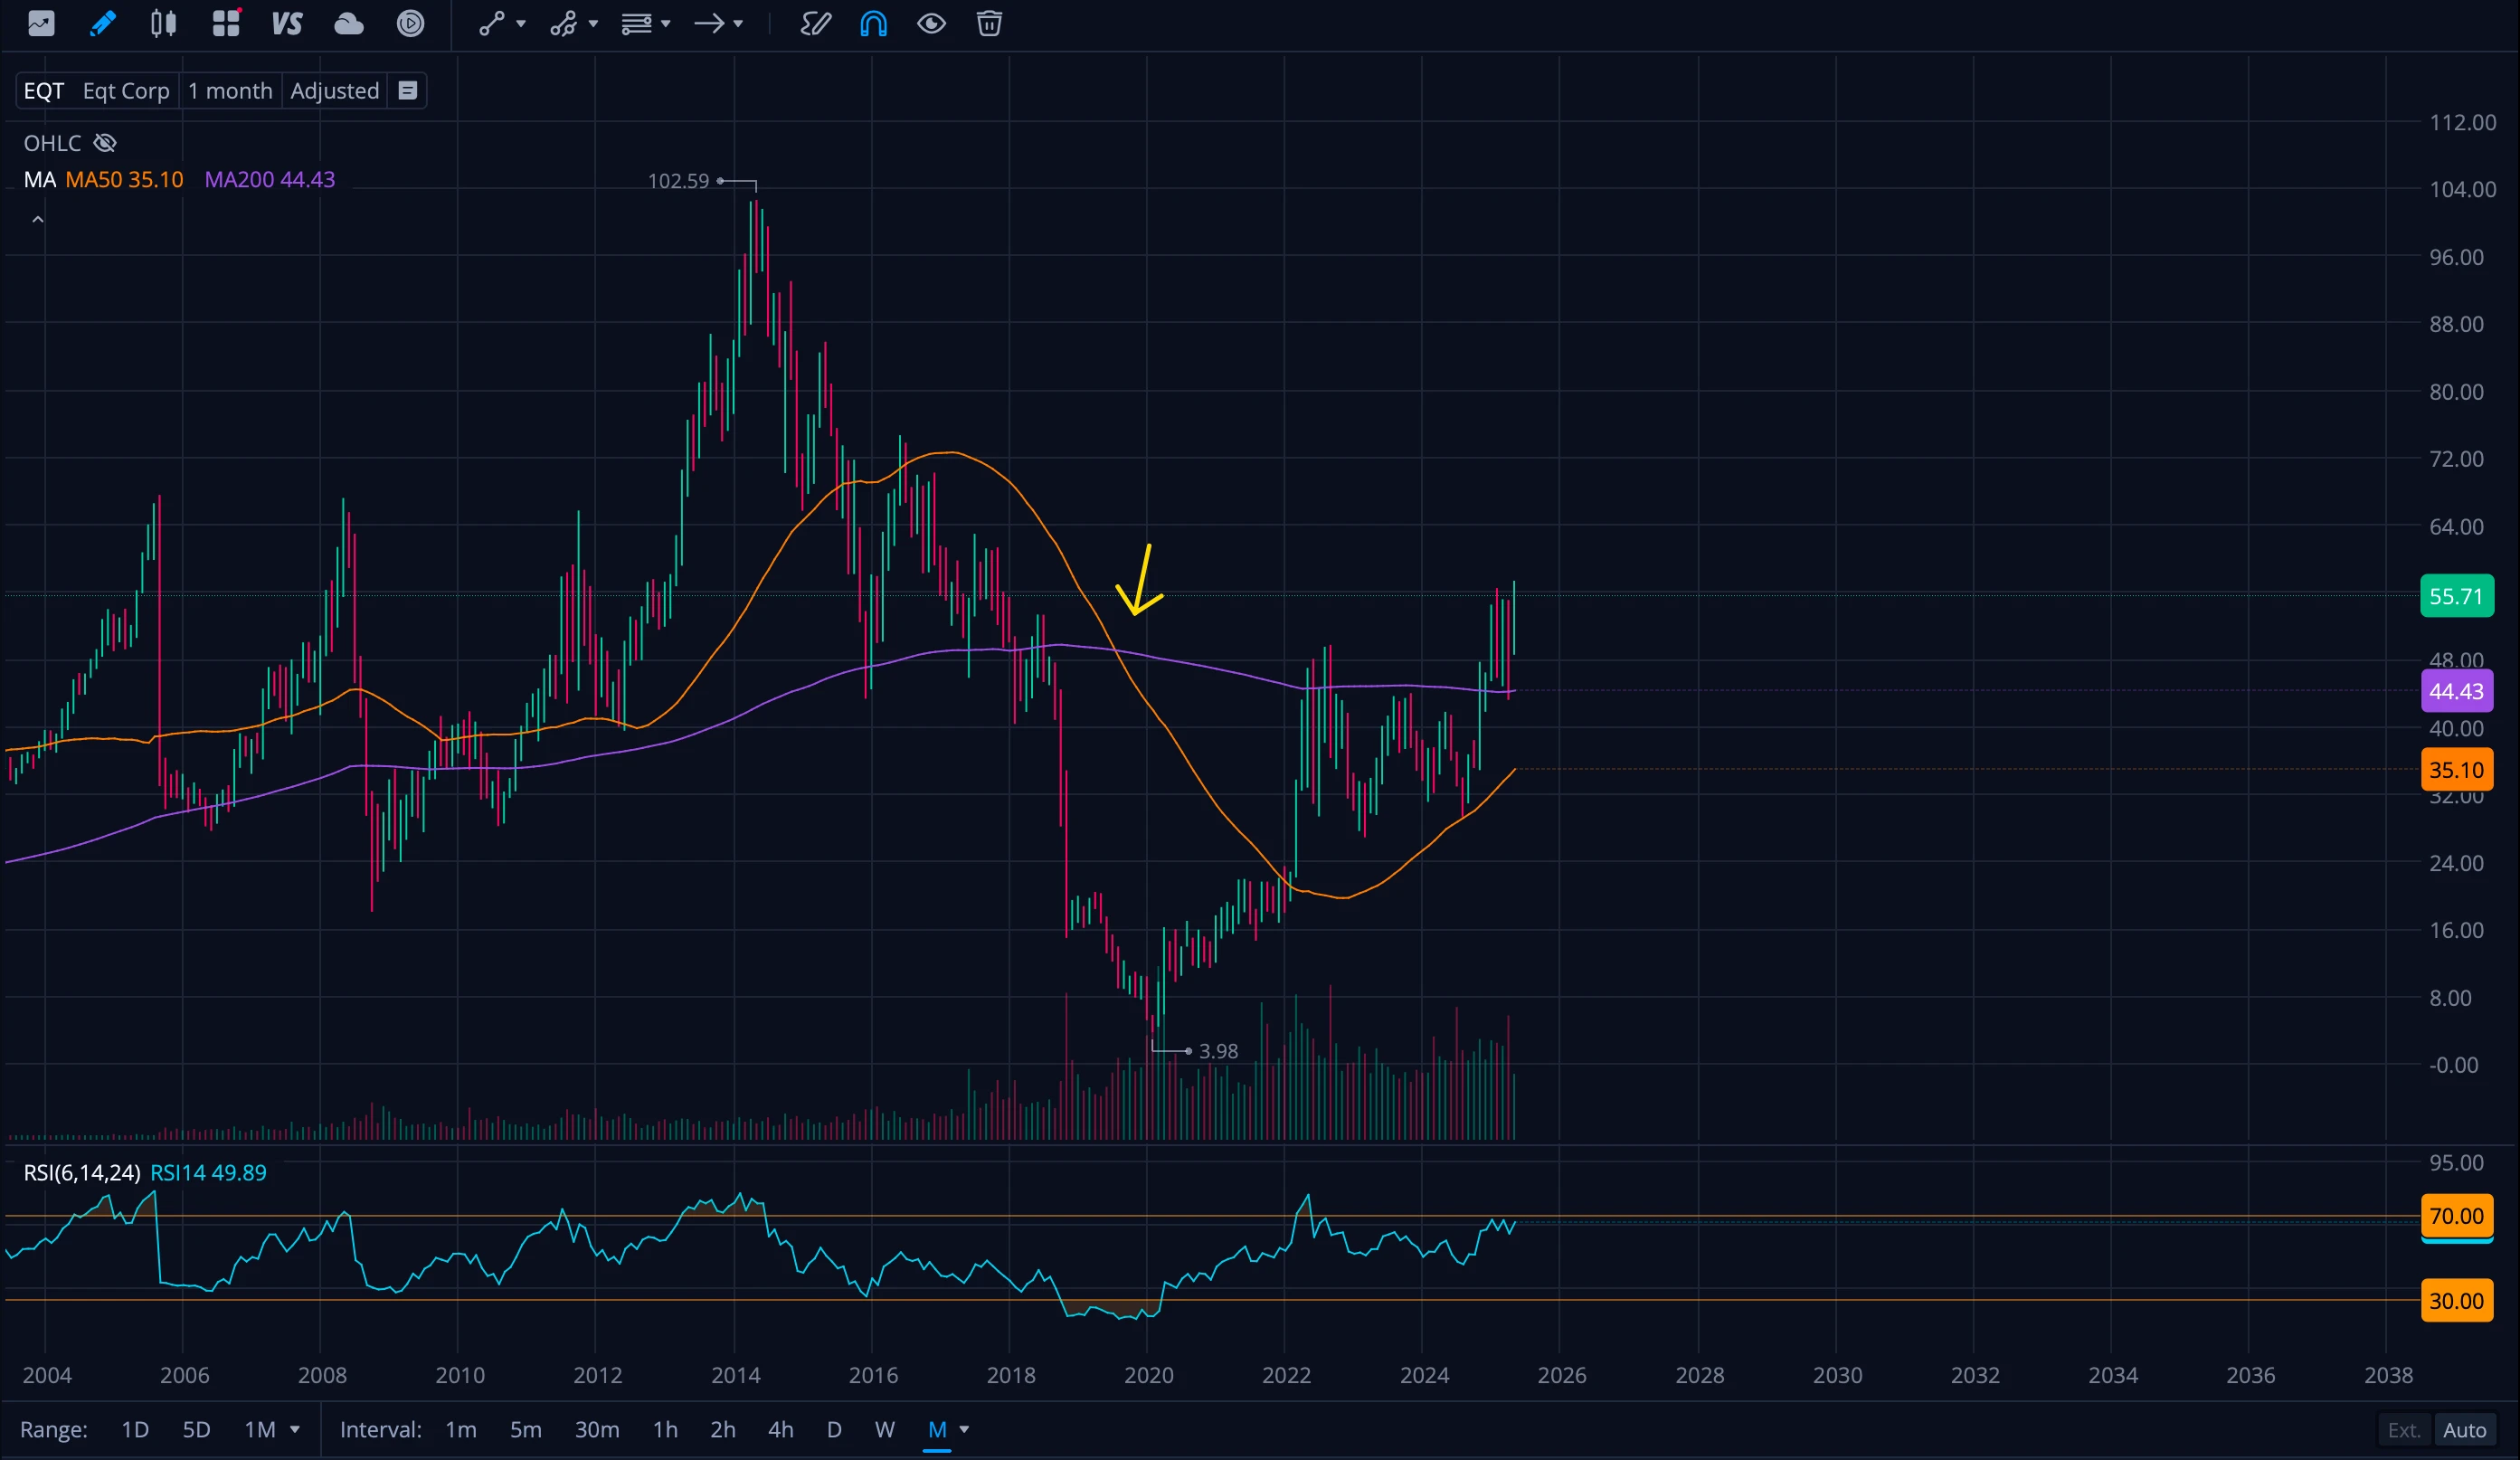
Monthly Charts (Long-term perspective)
Monthly death crosses are rare and significant. They often signal major structural changes that can last years. These are the ones long-term investors pay attention to.
Why they're important:
- Extremely reliable for identifying major bear markets
- Often coincide with fundamental business changes
- Can help avoid extended periods of poor performance
Calculate Your Position Size
Take the guesswork out of risk management. Our Position Size Calculator helps you determine the optimal trade size based on your risk tolerance and account balance.
Try Position CalculatorWhen Death Crosses Work vs. When They Don't
More reliable when:
- They happen after big price increases
- Trading volume increases during the cross
- Multiple timeframes show the same signal
- The stock breaks important support levels at the same time
Less reliable when:
- The overall market is very strong
- Volume is low during the cross
- The stock quickly moves back above both averages
- The stock has already fallen significantly
Important:
Death crosses are lagging indicators. By the time they form, the stock has usually already dropped 10-20%. They confirm weakness rather than predict it.
How to Apply This
Identify the cross
Look for the moment when the 50-day moving average drops below the 200-day moving average. Most charting platforms will show these lines clearly.
Check the context
- What timeframe are you looking at?
- Is volume higher than normal during the cross?
- Has the stock already fallen significantly?
- What's the overall market doing?
Use it for risk management
Death crosses work best as risk alerts, not trading signals. When you spot one:
- Consider if you want to hold the same position size
- Look at your stop-loss levels
- Think about whether this fits your time horizon
Wait for confirmation
Don't act immediately. Watch what happens over the next few days or weeks:
- Does the stock stay below both moving averages?
- Does volume stay elevated?
- Are other technical indicators confirming weakness?
Combine with other analysis
Never use death crosses alone. Check:
- Company fundamentals
- Sector trends
- Support and resistance levels
- Other technical indicators
Common Mistakes
Treating all death crosses the same: A death cross in a stock that's up 100% this year is different from one in a stock that's already down 30%.
Ignoring volume: Crosses with high volume are more significant than those with low volume.
Forgetting market context: Individual stock death crosses during strong bull markets often reverse quickly.
Overreacting: Death crosses don't mean you should immediately sell everything.
The Golden Cross Connection
The opposite of a death cross is a golden cross - when the 50-day moving average crosses above the 200-day moving average. Markets cycle between these two states:
- Golden cross forms (bullish signal)
- Uptrend continues
- Price weakness appears
- Death cross forms (bearish signal)
- Downtrend continues
- Eventually, another golden cross forms
Understanding both signals gives you a complete picture of trend changes.
Bottom Line
Death crosses are useful for confirming that uptrends are ending, but they're not crystal balls. They work best when combined with other analysis and used for risk management rather than timing decisions.
Use death crosses to:
- Confirm trend changes
- Adjust your risk exposure
- Time defensive moves in your portfolio
Don't use them to:
- Make all-in or all-out decisions
- Override fundamental analysis
- Time perfect entries or exits
The key is treating death crosses as one piece of information, not the complete answer. They're most valuable when they align with other technical and fundamental factors pointing in the same direction.