Latest from ChartBreakdown
Technical analysis insights and market education without the hype. Just real insights to help you trade smarter.
-
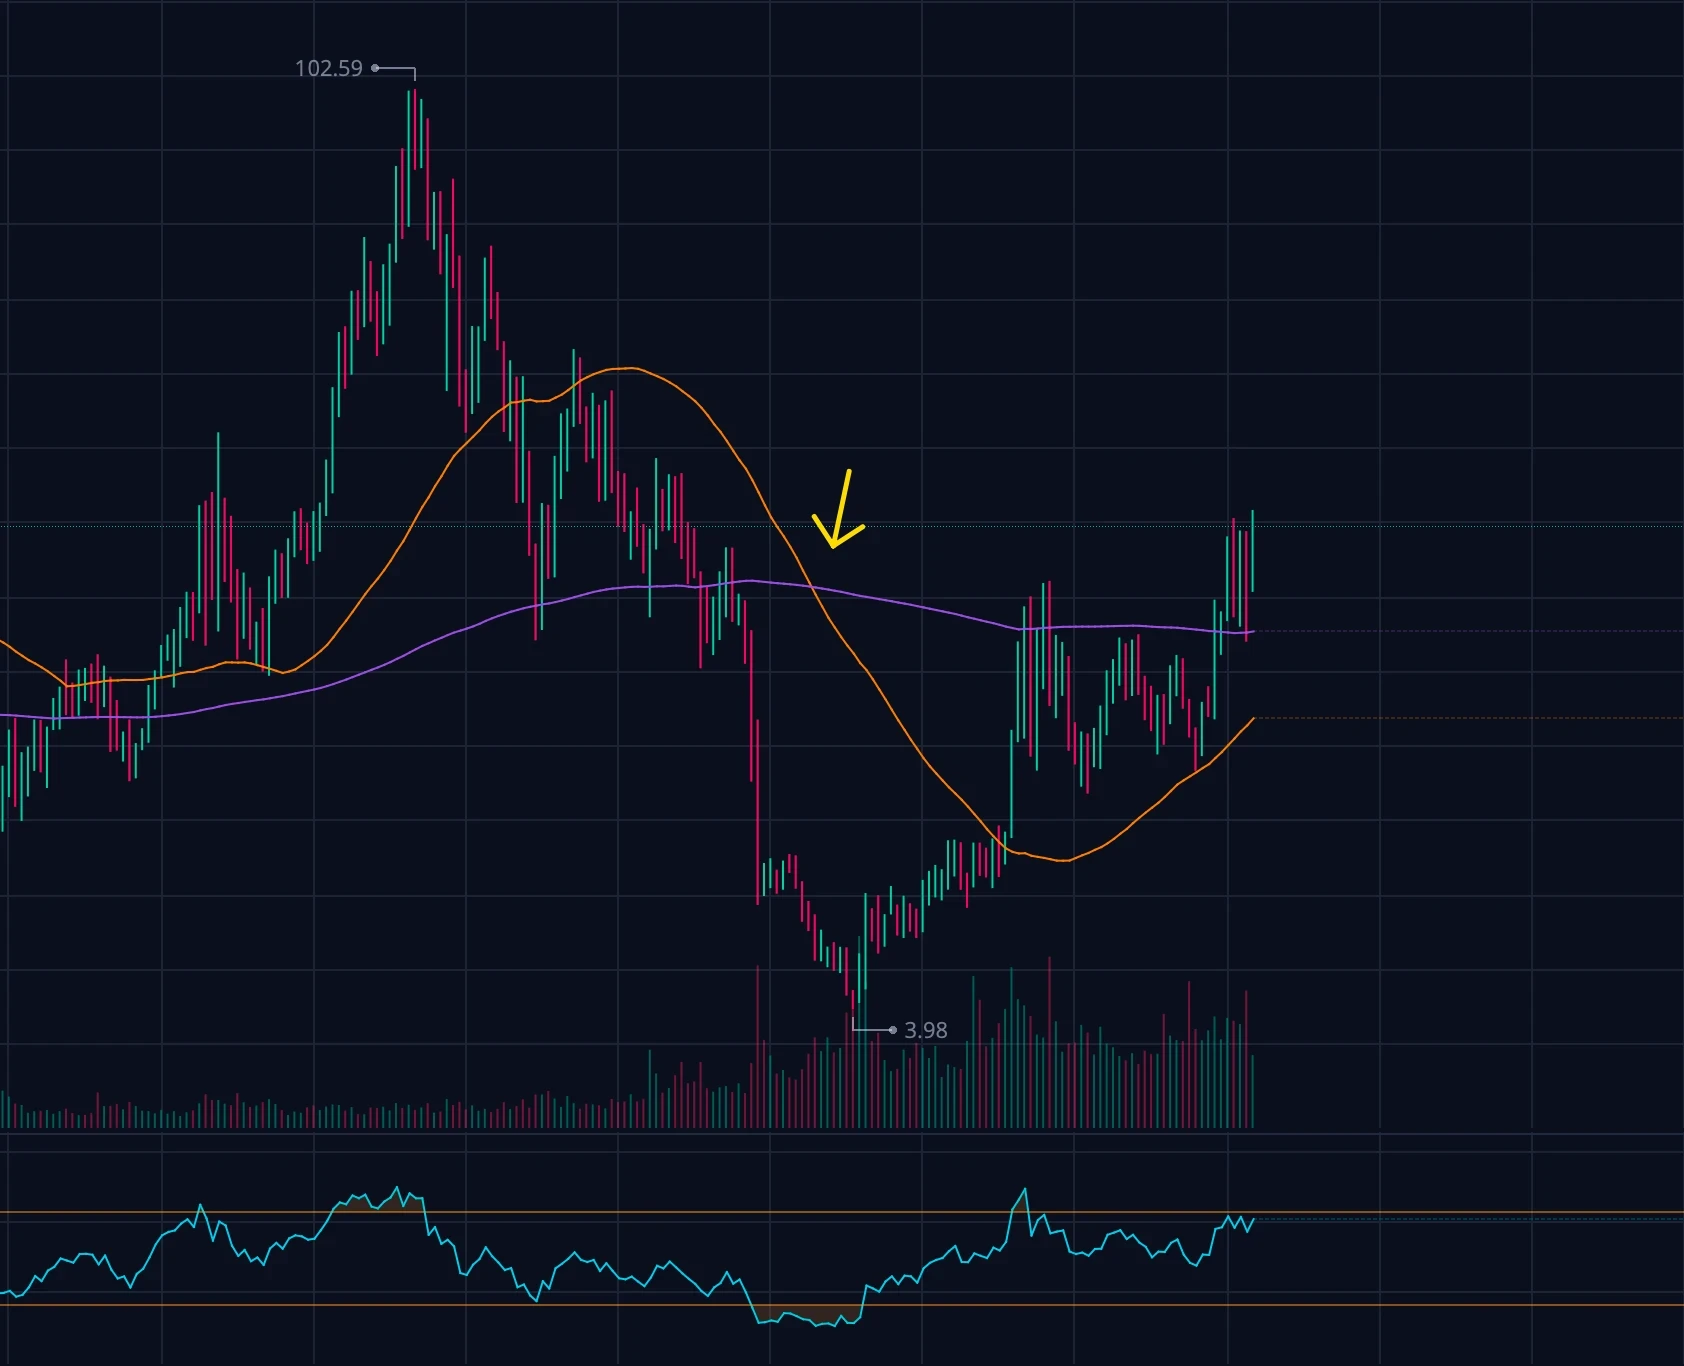
Death Cross: What It Is and How to Read It
Learn what a death cross is, how to spot it on charts, and how to use this technical analysis signal for better risk management.
5/21/2025
-

Building a Daily Routine for Effective Stock Market Analysis
A structured guide to improving your stock market technical analysis.
3/25/2025