Master the Markets with Technical Analysis That Works
Stop guessing. Start reading stock charts like a pro.
We simplify technical analysis, RSI, and stock indicators so you can spot trends, time your trades, and invest with confidence.
Track Price Evolution. Master Chart Patterns.
Charts reveal market psychology. When you follow a stock's journey.
Each week, we analyze the same stocks (like OKLO, TSLA, and PLTR) across multiple time frames, showing you how chart patterns develop and resolve. By tracking the same securities over time, you'll learn to spot key support/resistance levels, recognize RSI divergences, and understand how volume confirms price action. No predictions or hype. Just practical technical analysis that builds your pattern recognition skills. Swipe through our latest OKLO analysis below to see how the story unfolds.
OKLO Approaches Key Support – Will Buyers Step In?
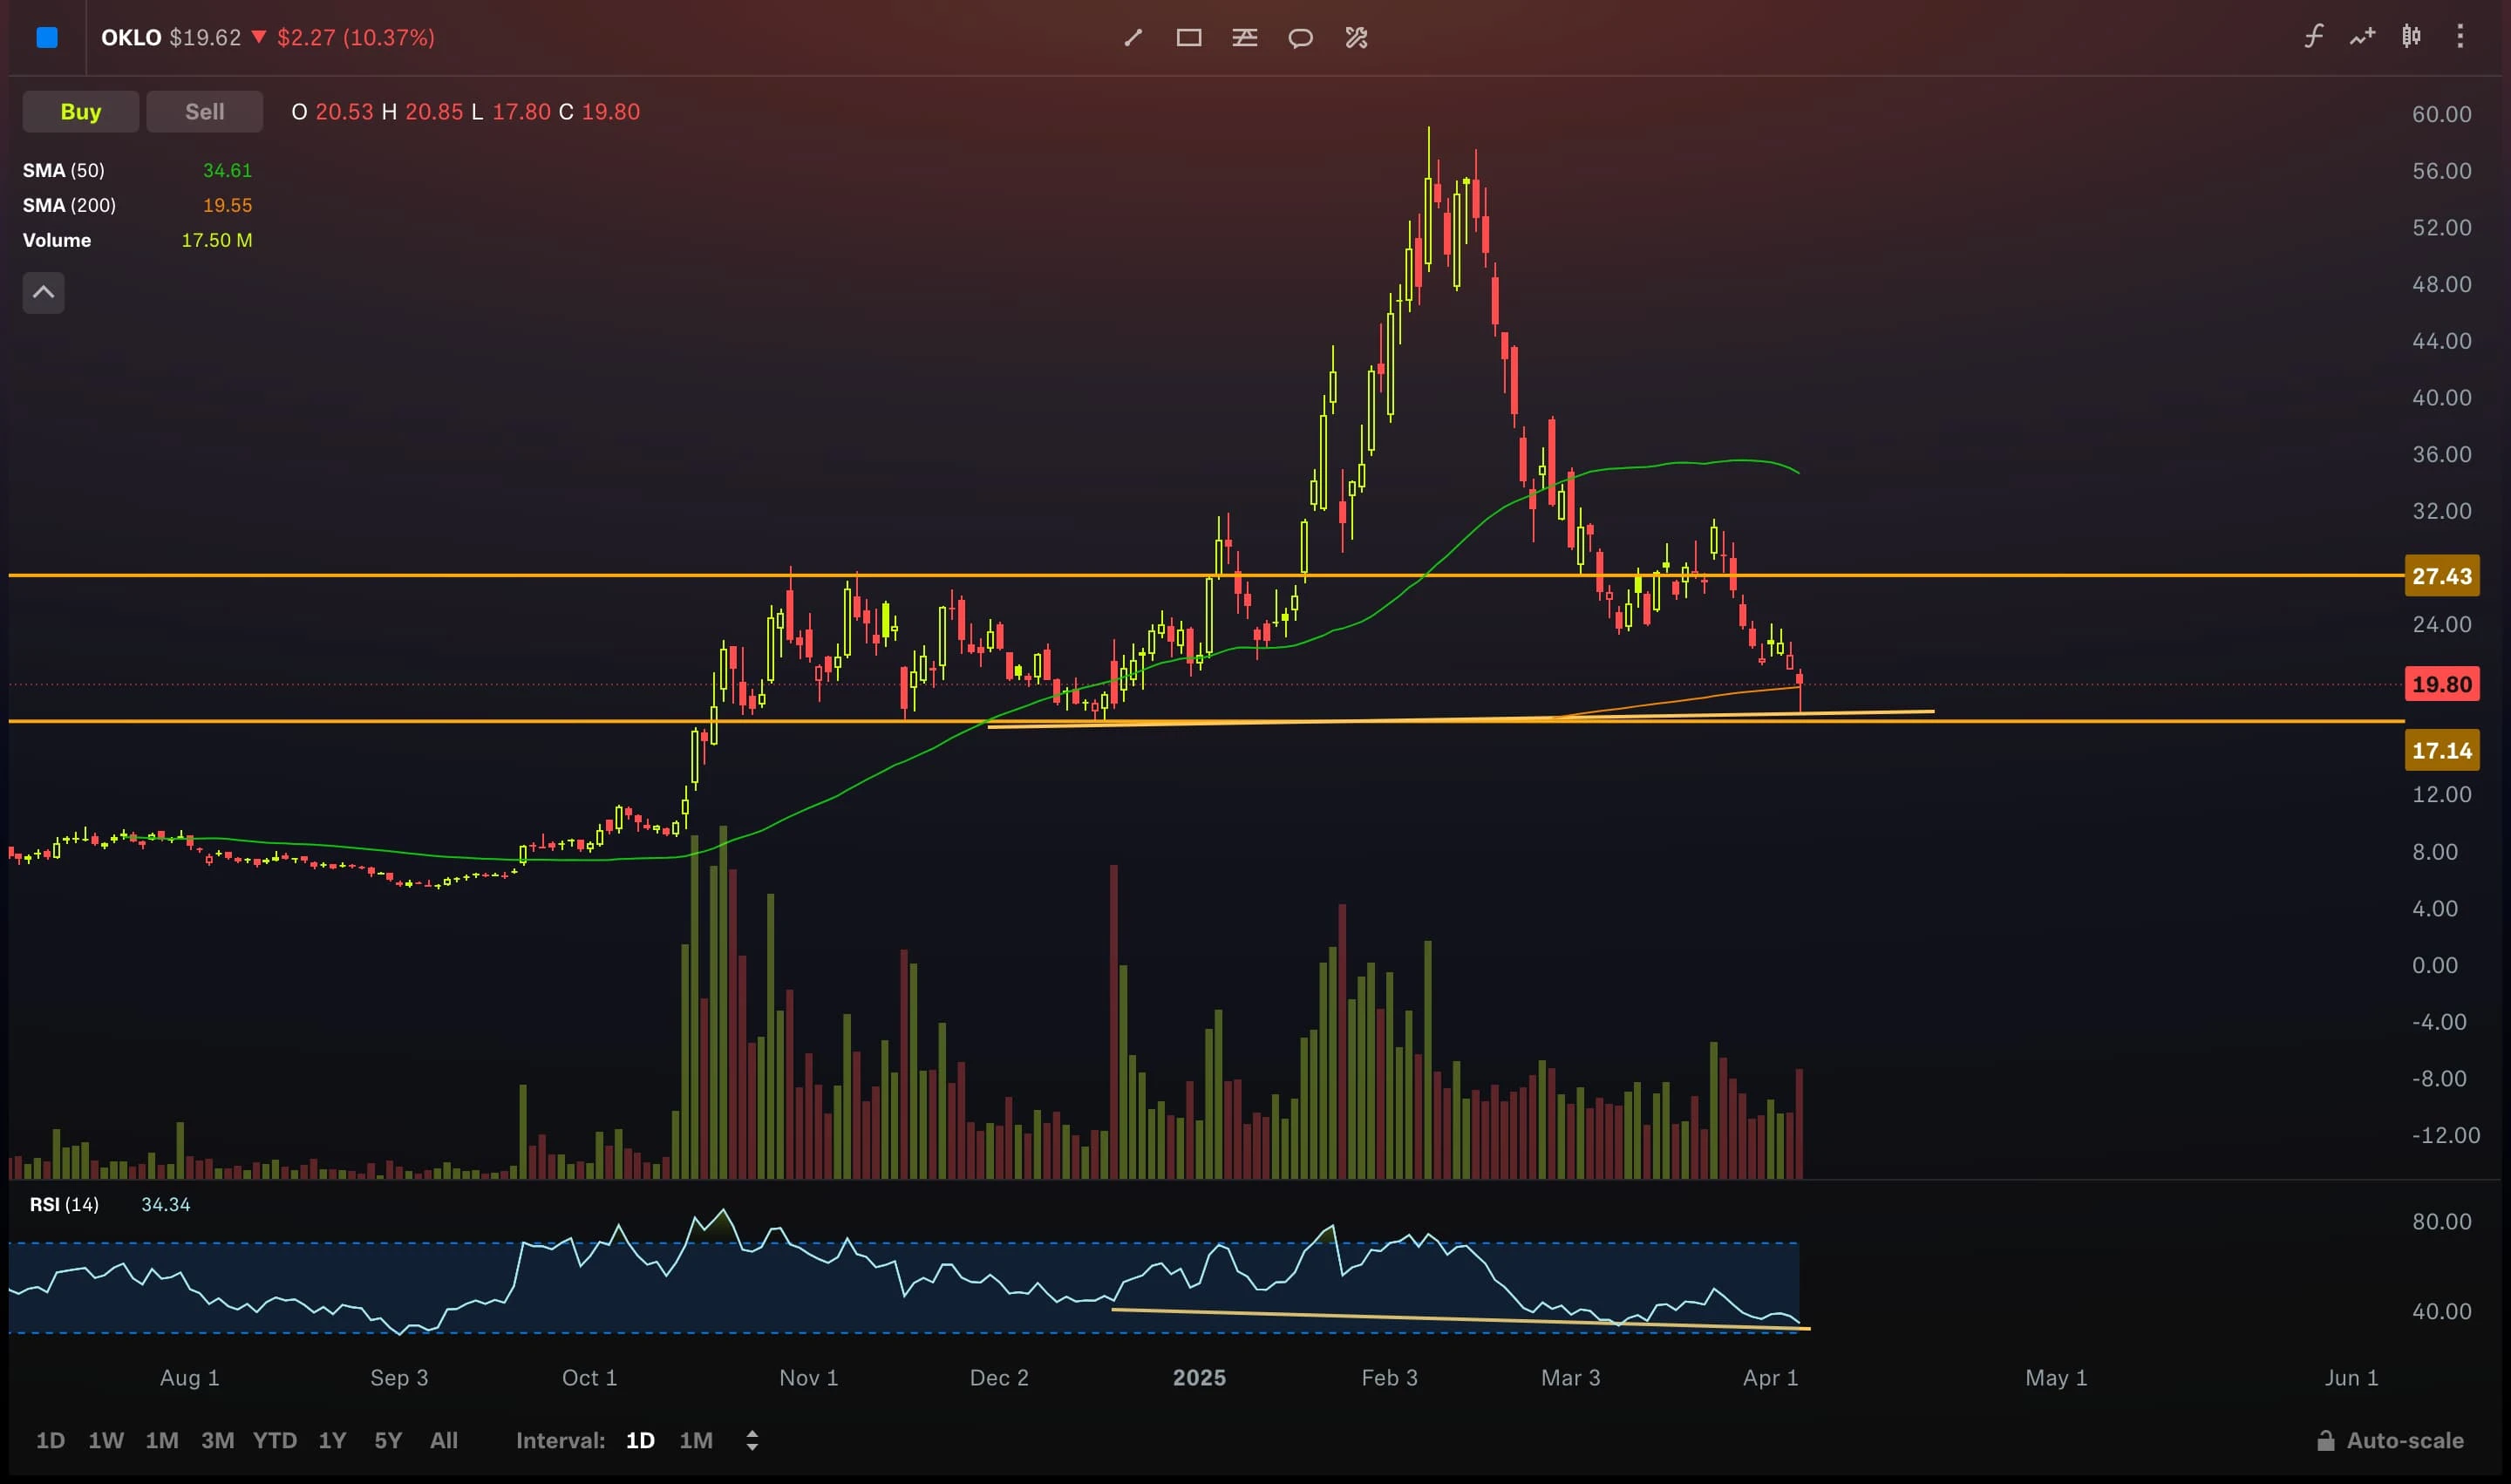
Recap: OKLO has pulled back from its highs near $56 and is now testing a key support zone around $19.80, with the 200-day SMA just below.
Insights: Price is respecting horizontal support while forming a potential bullish divergence on RSI. Volume has picked up on recent declines, suggesting strong market interest at these levels.
Market Dynamics: The 200-day moving average is acting as dynamic support. RSI is nearing oversold conditions, historically leading to short-term bounces. Buyers have defended this price range before, making it a critical level to watch.
OKLO Bounces from Key Support – What Comes Next?
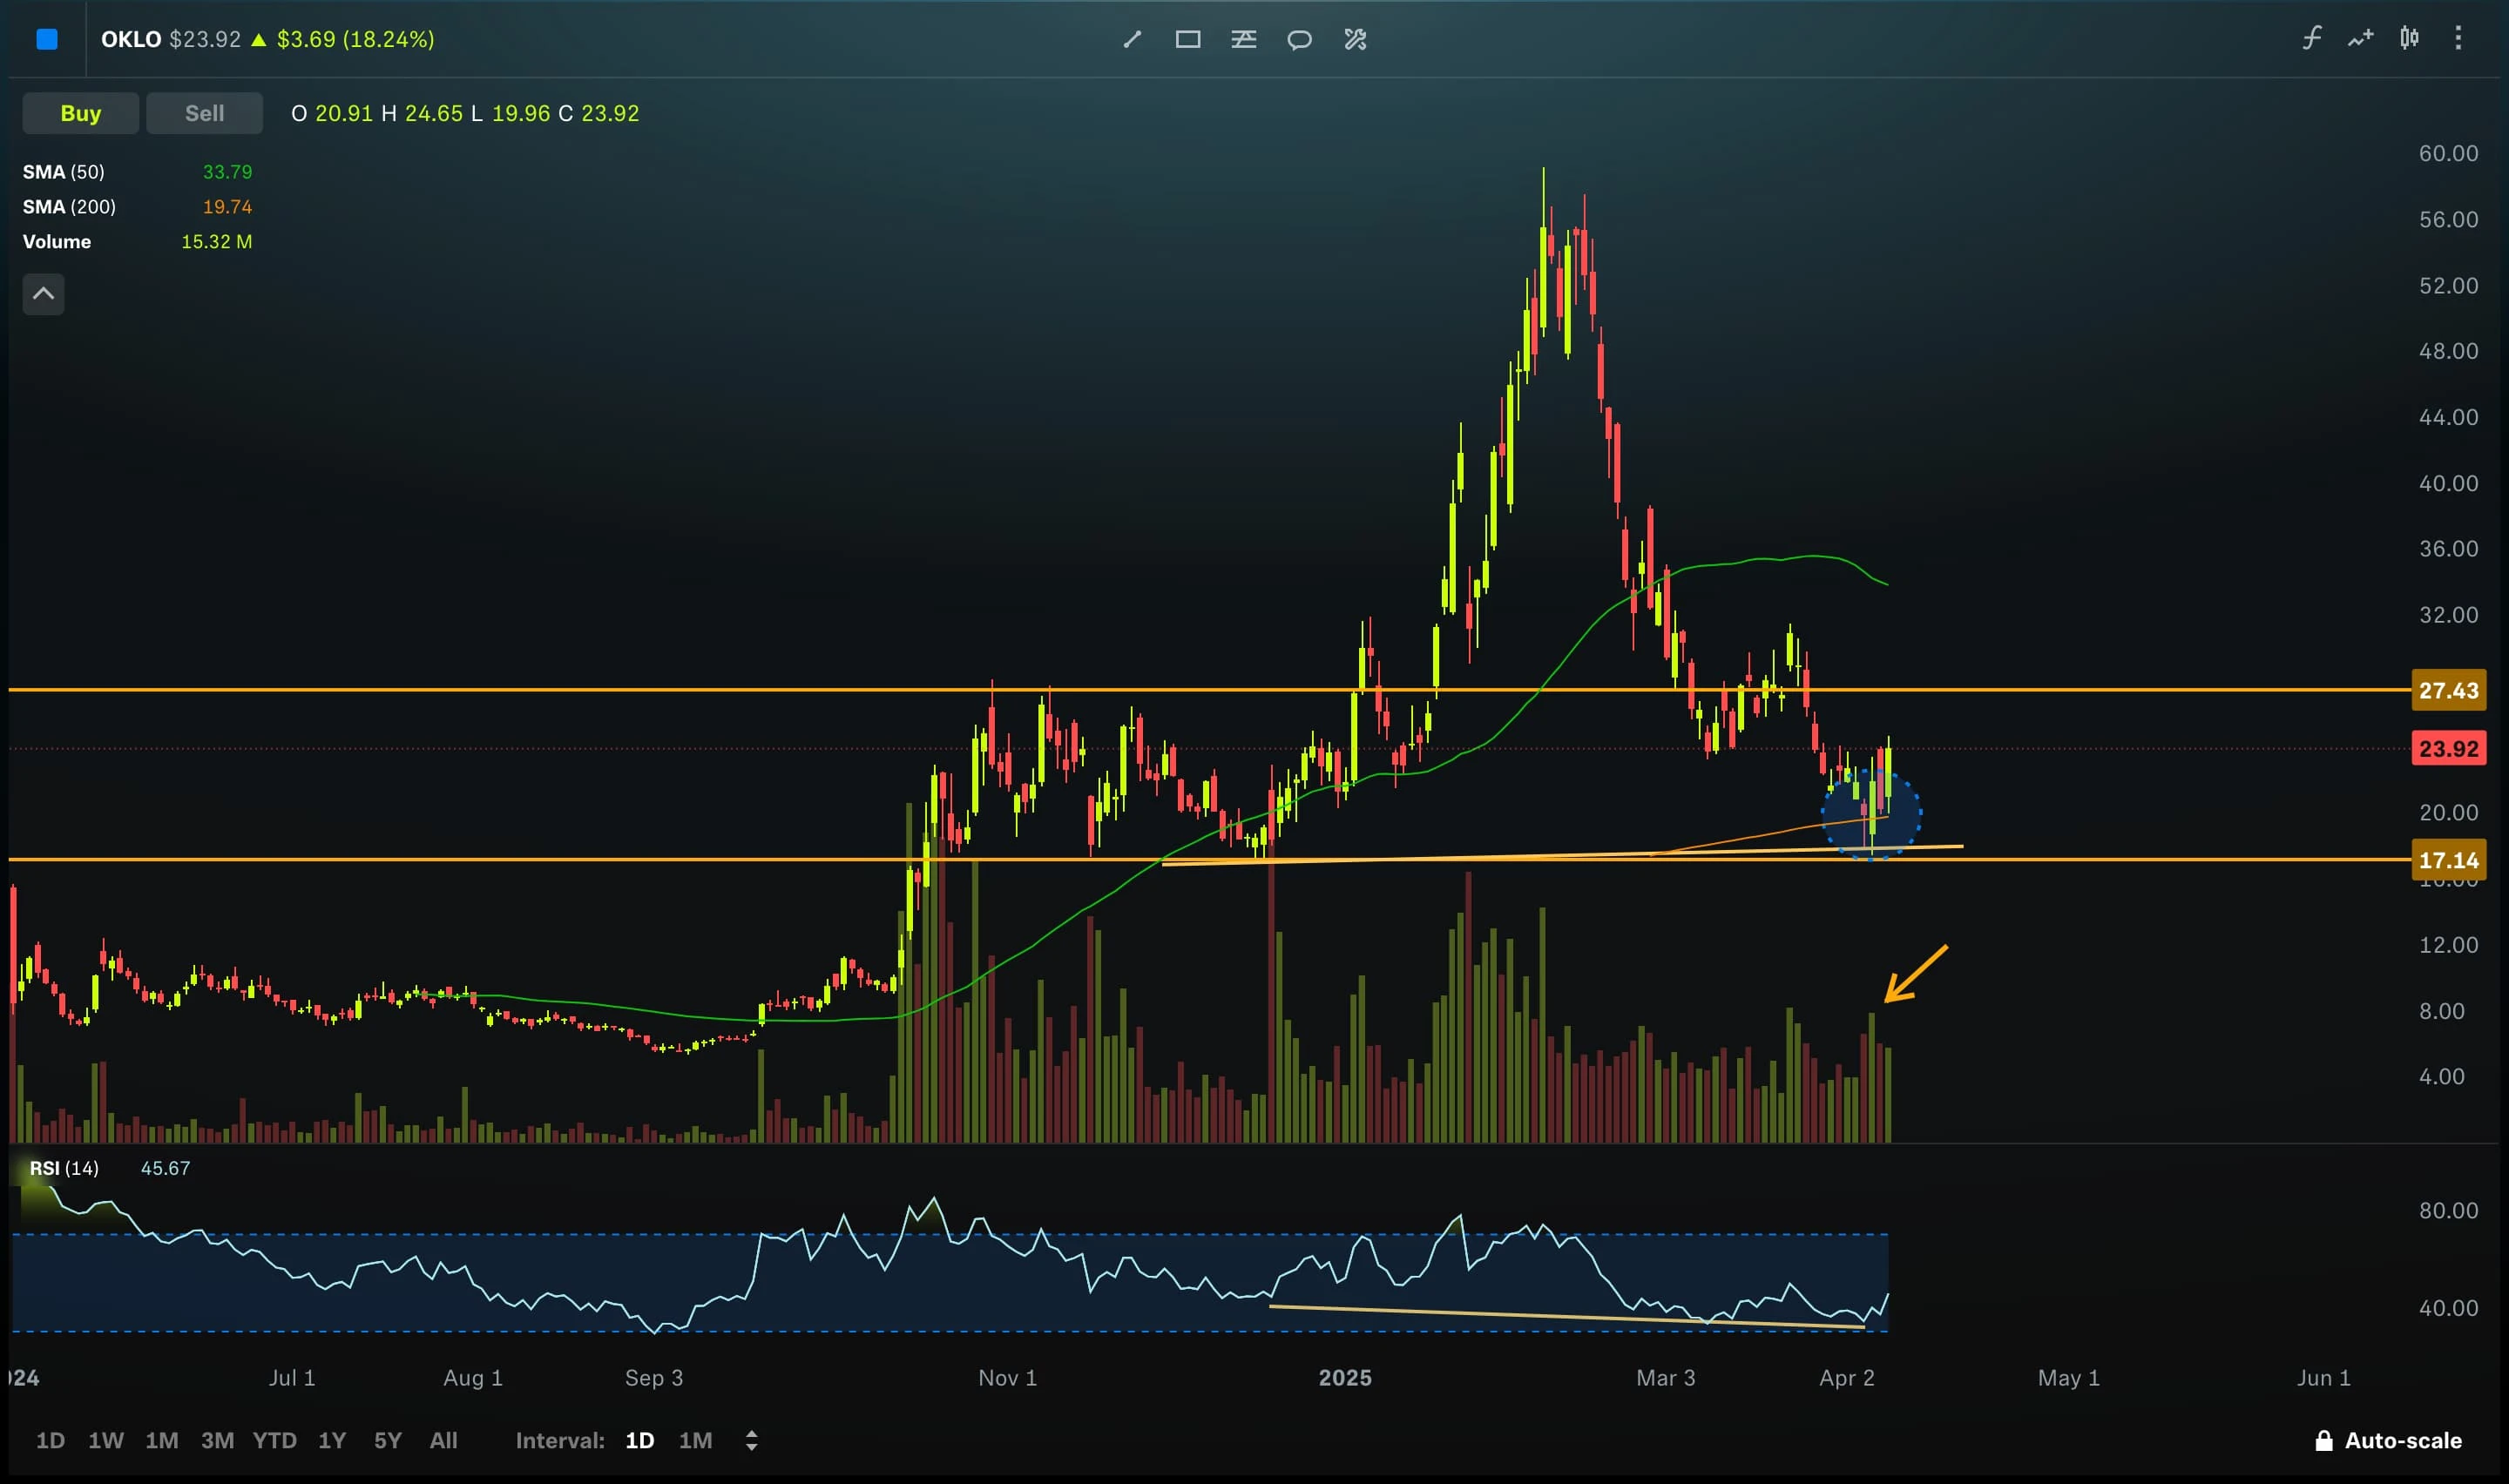
Recap: OKLO pulled back to long-term support near $19.80, aligned with the 200-day SMA. We saw early signs of a bullish divergence on RSI and a volume increase, both potential indicators of a reversal.
Insights: This week, OKLO bounced off that support zone, now trading around $23.92. Increased volume and an RSI recovery from oversold levels suggest momentum is shifting in favor of buyers.
Market Dynamics: The 200-day SMA continues to provide strong support, and the volume spike adds credibility to the move. RSI remains in the mid-40s, leaving room for further upside before hitting overbought levels.
Everyone's approach to the market is different — consider this one perspective, and always take time to do your own research.
Calculate Your Position Size
Take the guesswork out of risk management. Our Position Size Calculator helps you determine the optimal trade size based on your risk tolerance and account balance.
Try Position CalculatorStock Market Chart Patterns in Action
A Technical Analysis Archive
Explore our growing archive of evidence based technical analysis, highlighting stock market chart patterns and key trends over time. Whether you're learning stock trading or refining your strategy, these past breakdowns offer real market insights. No fluff, just pure technical analysis.
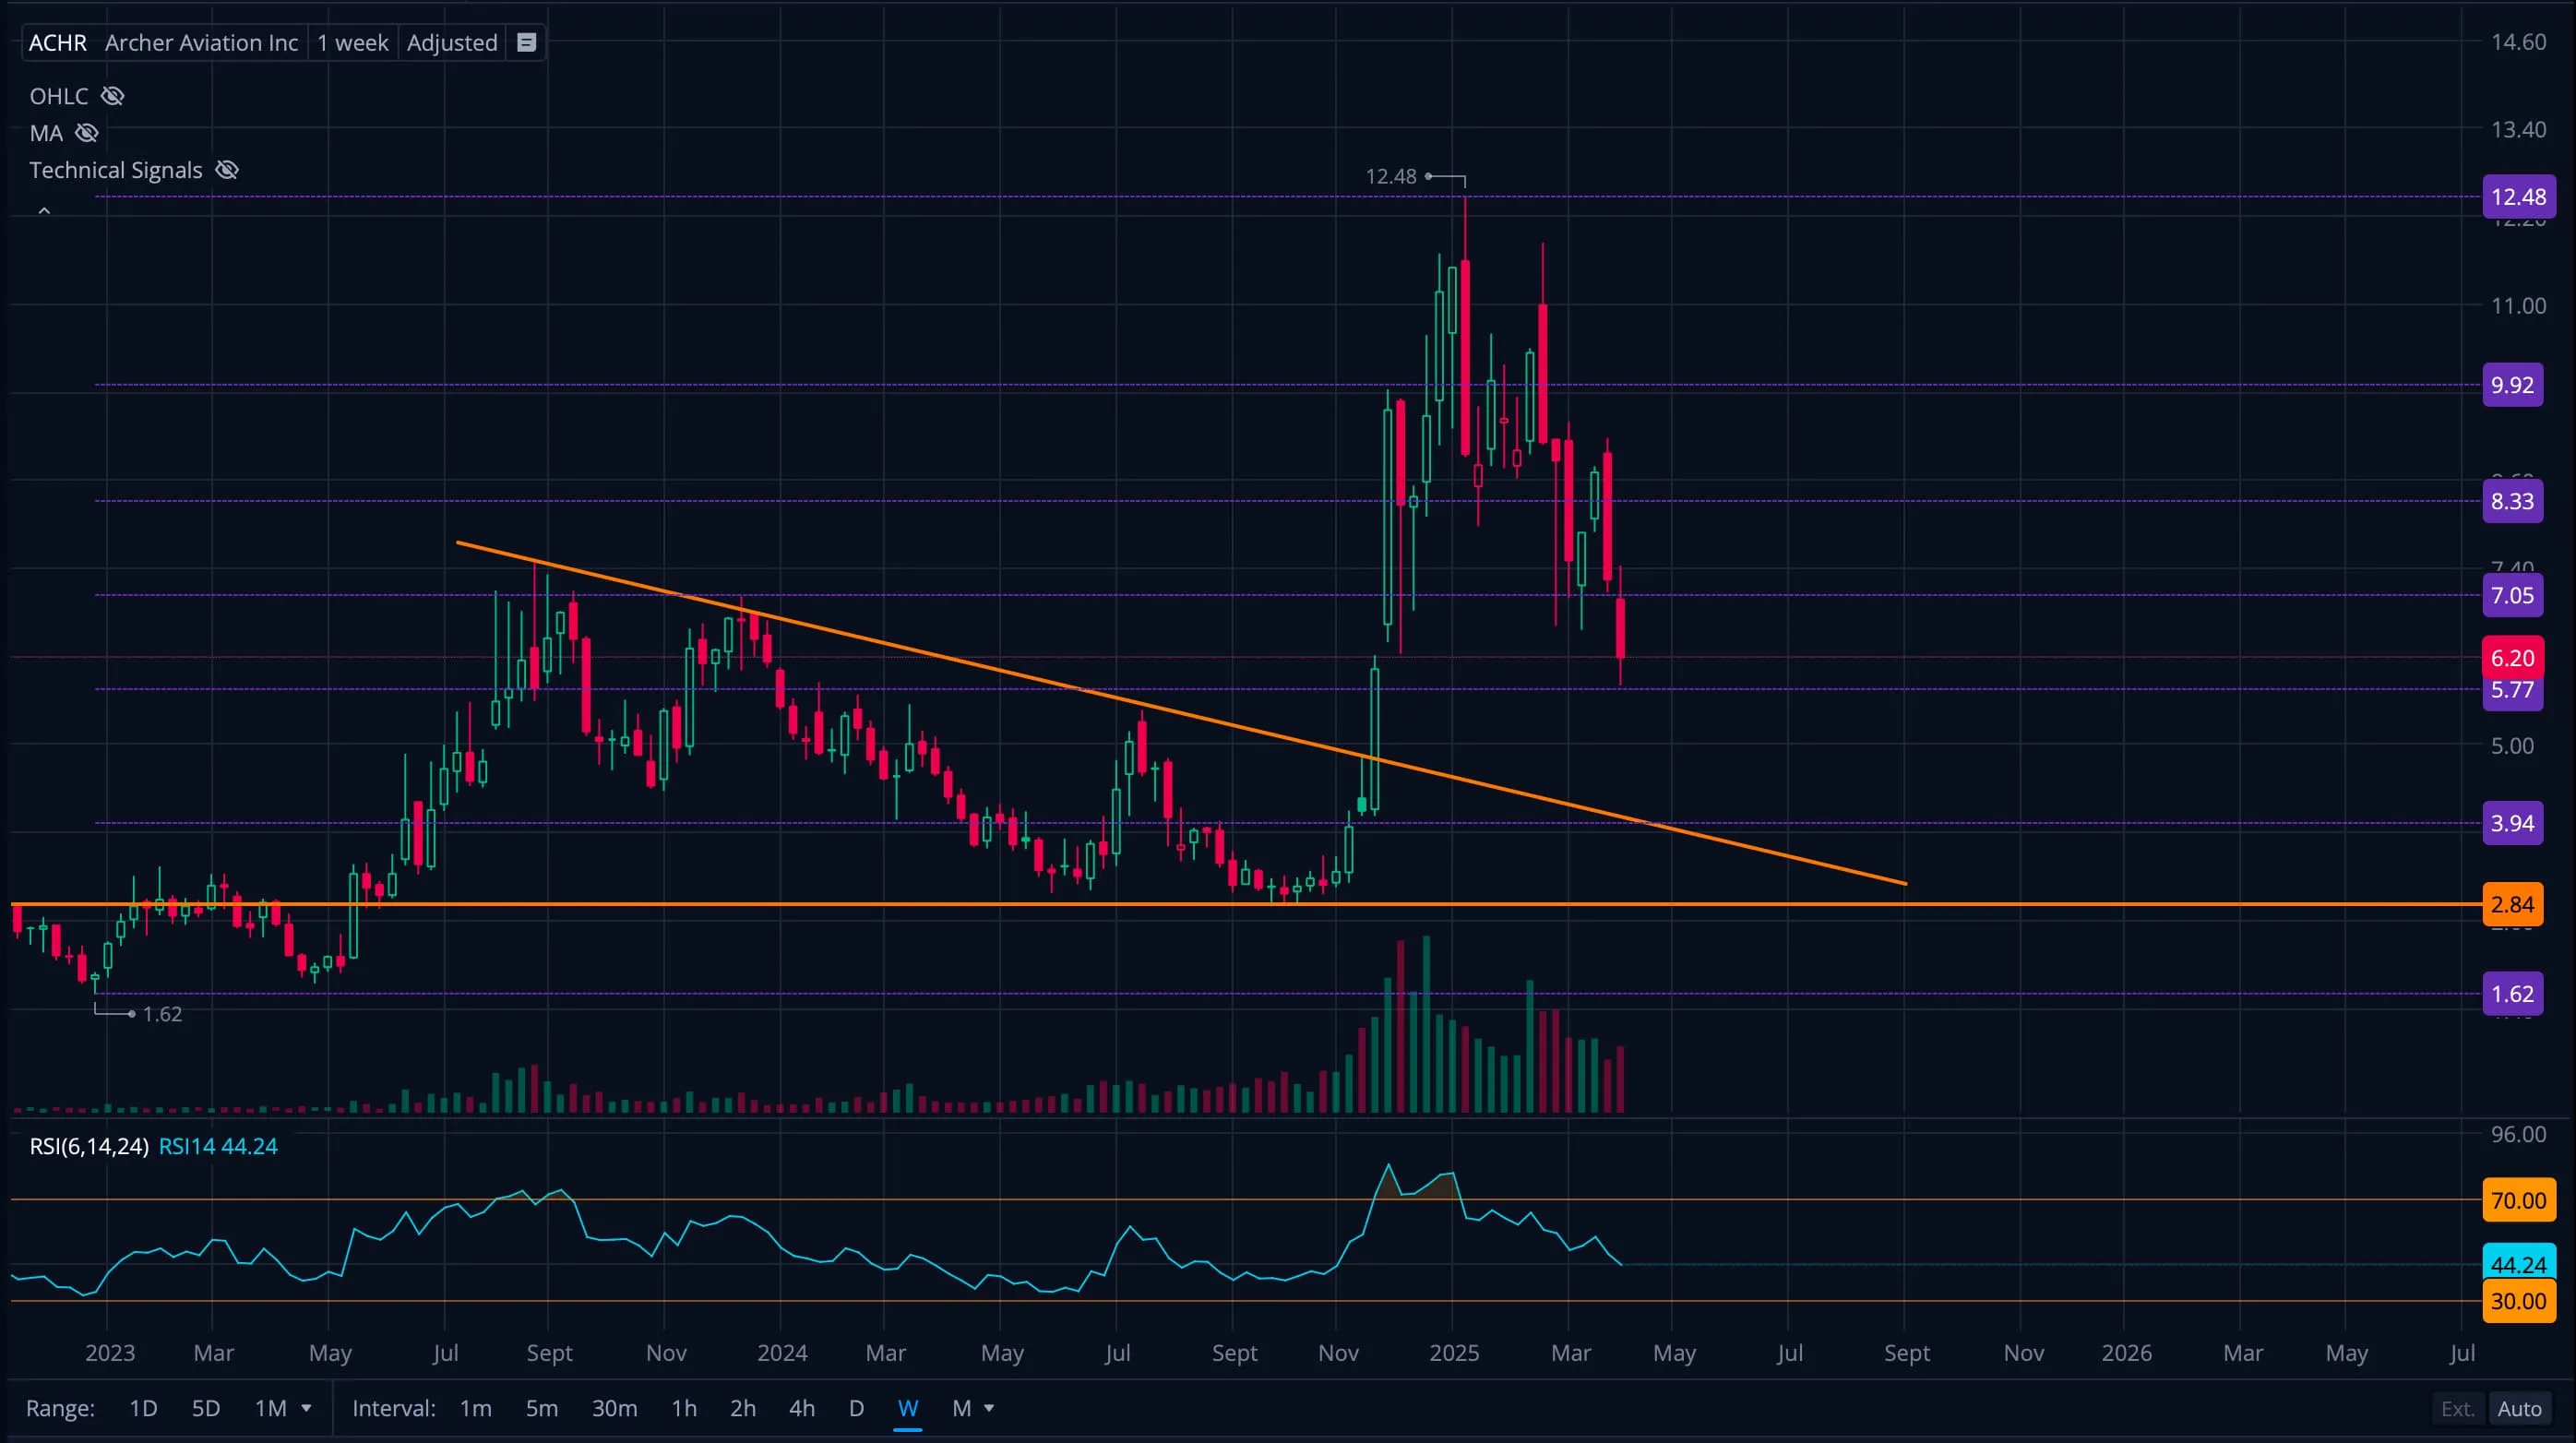
$ACHR - Weekly Chart
Date Analyzed: 04/04/2025
ACHR broke out of a long-term descending trendline, retested prior resistance as support, and is now consolidating near key Fibonacci retracement levels.
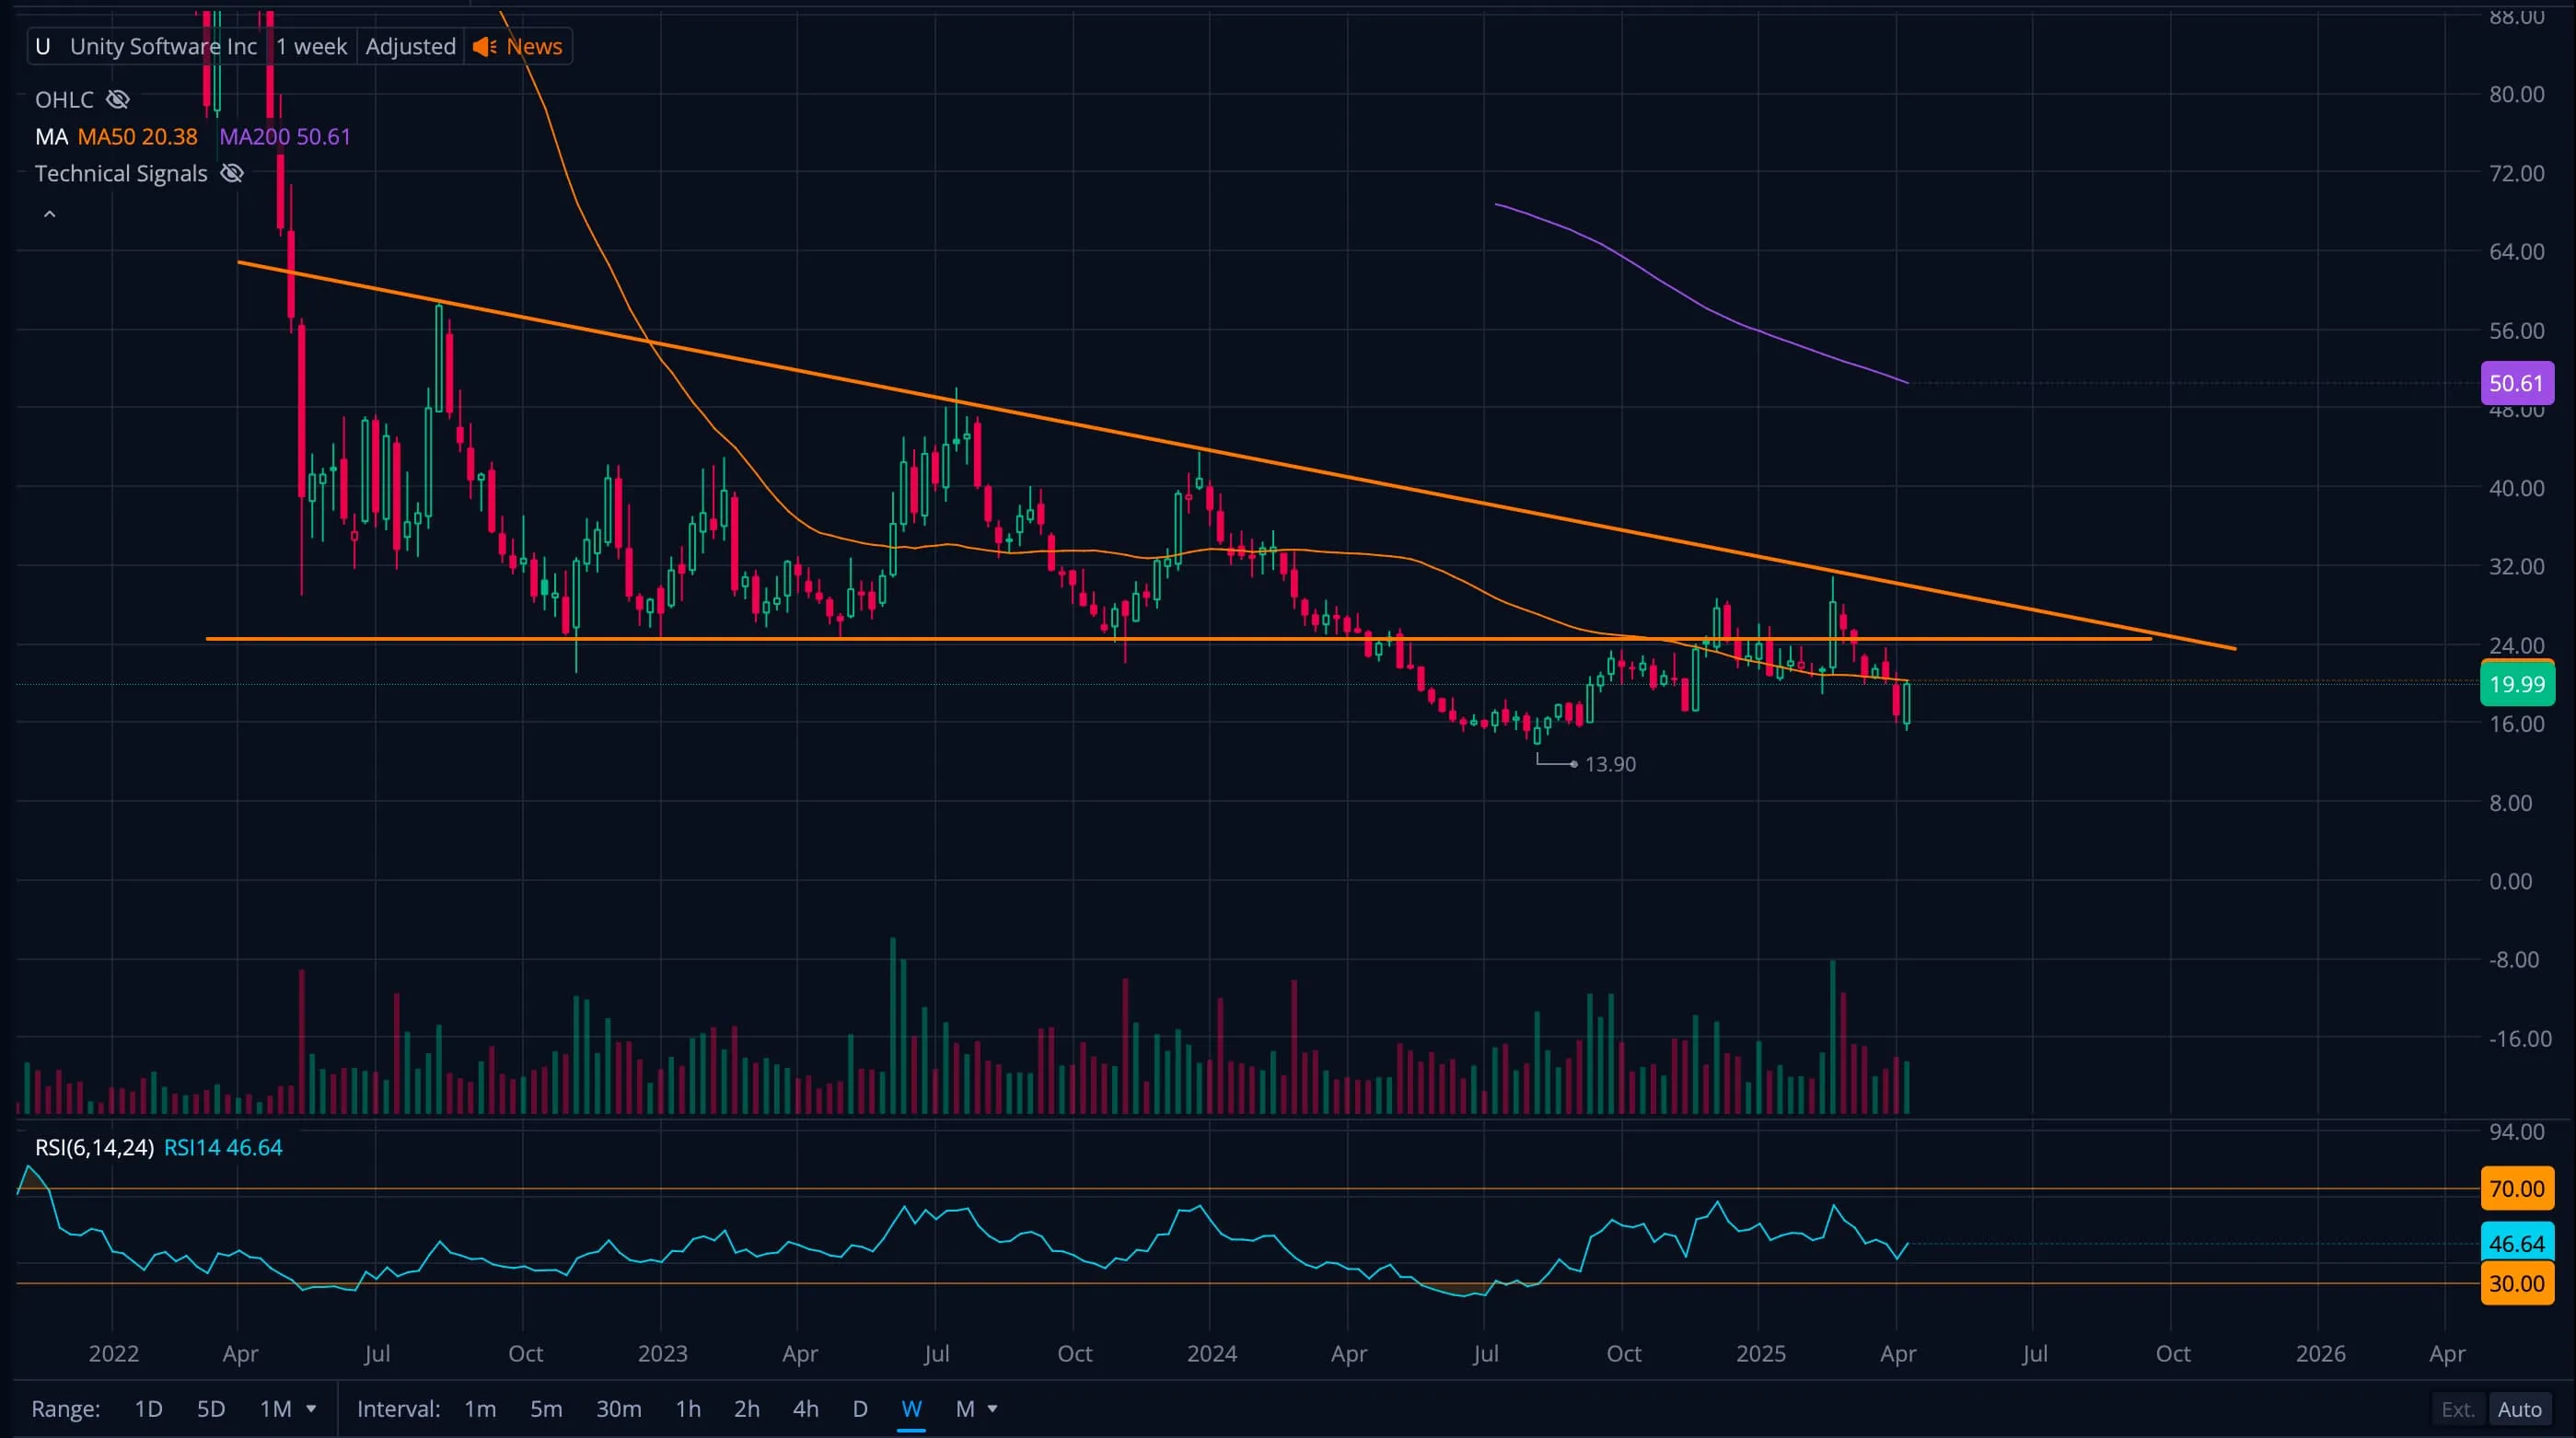
$U - Weekly Chart
Date Analyzed: 04/09/2025
U is compressing within a long-term descending triangle while holding $18–$20 support, with rising volume hinting at possible accumulation.
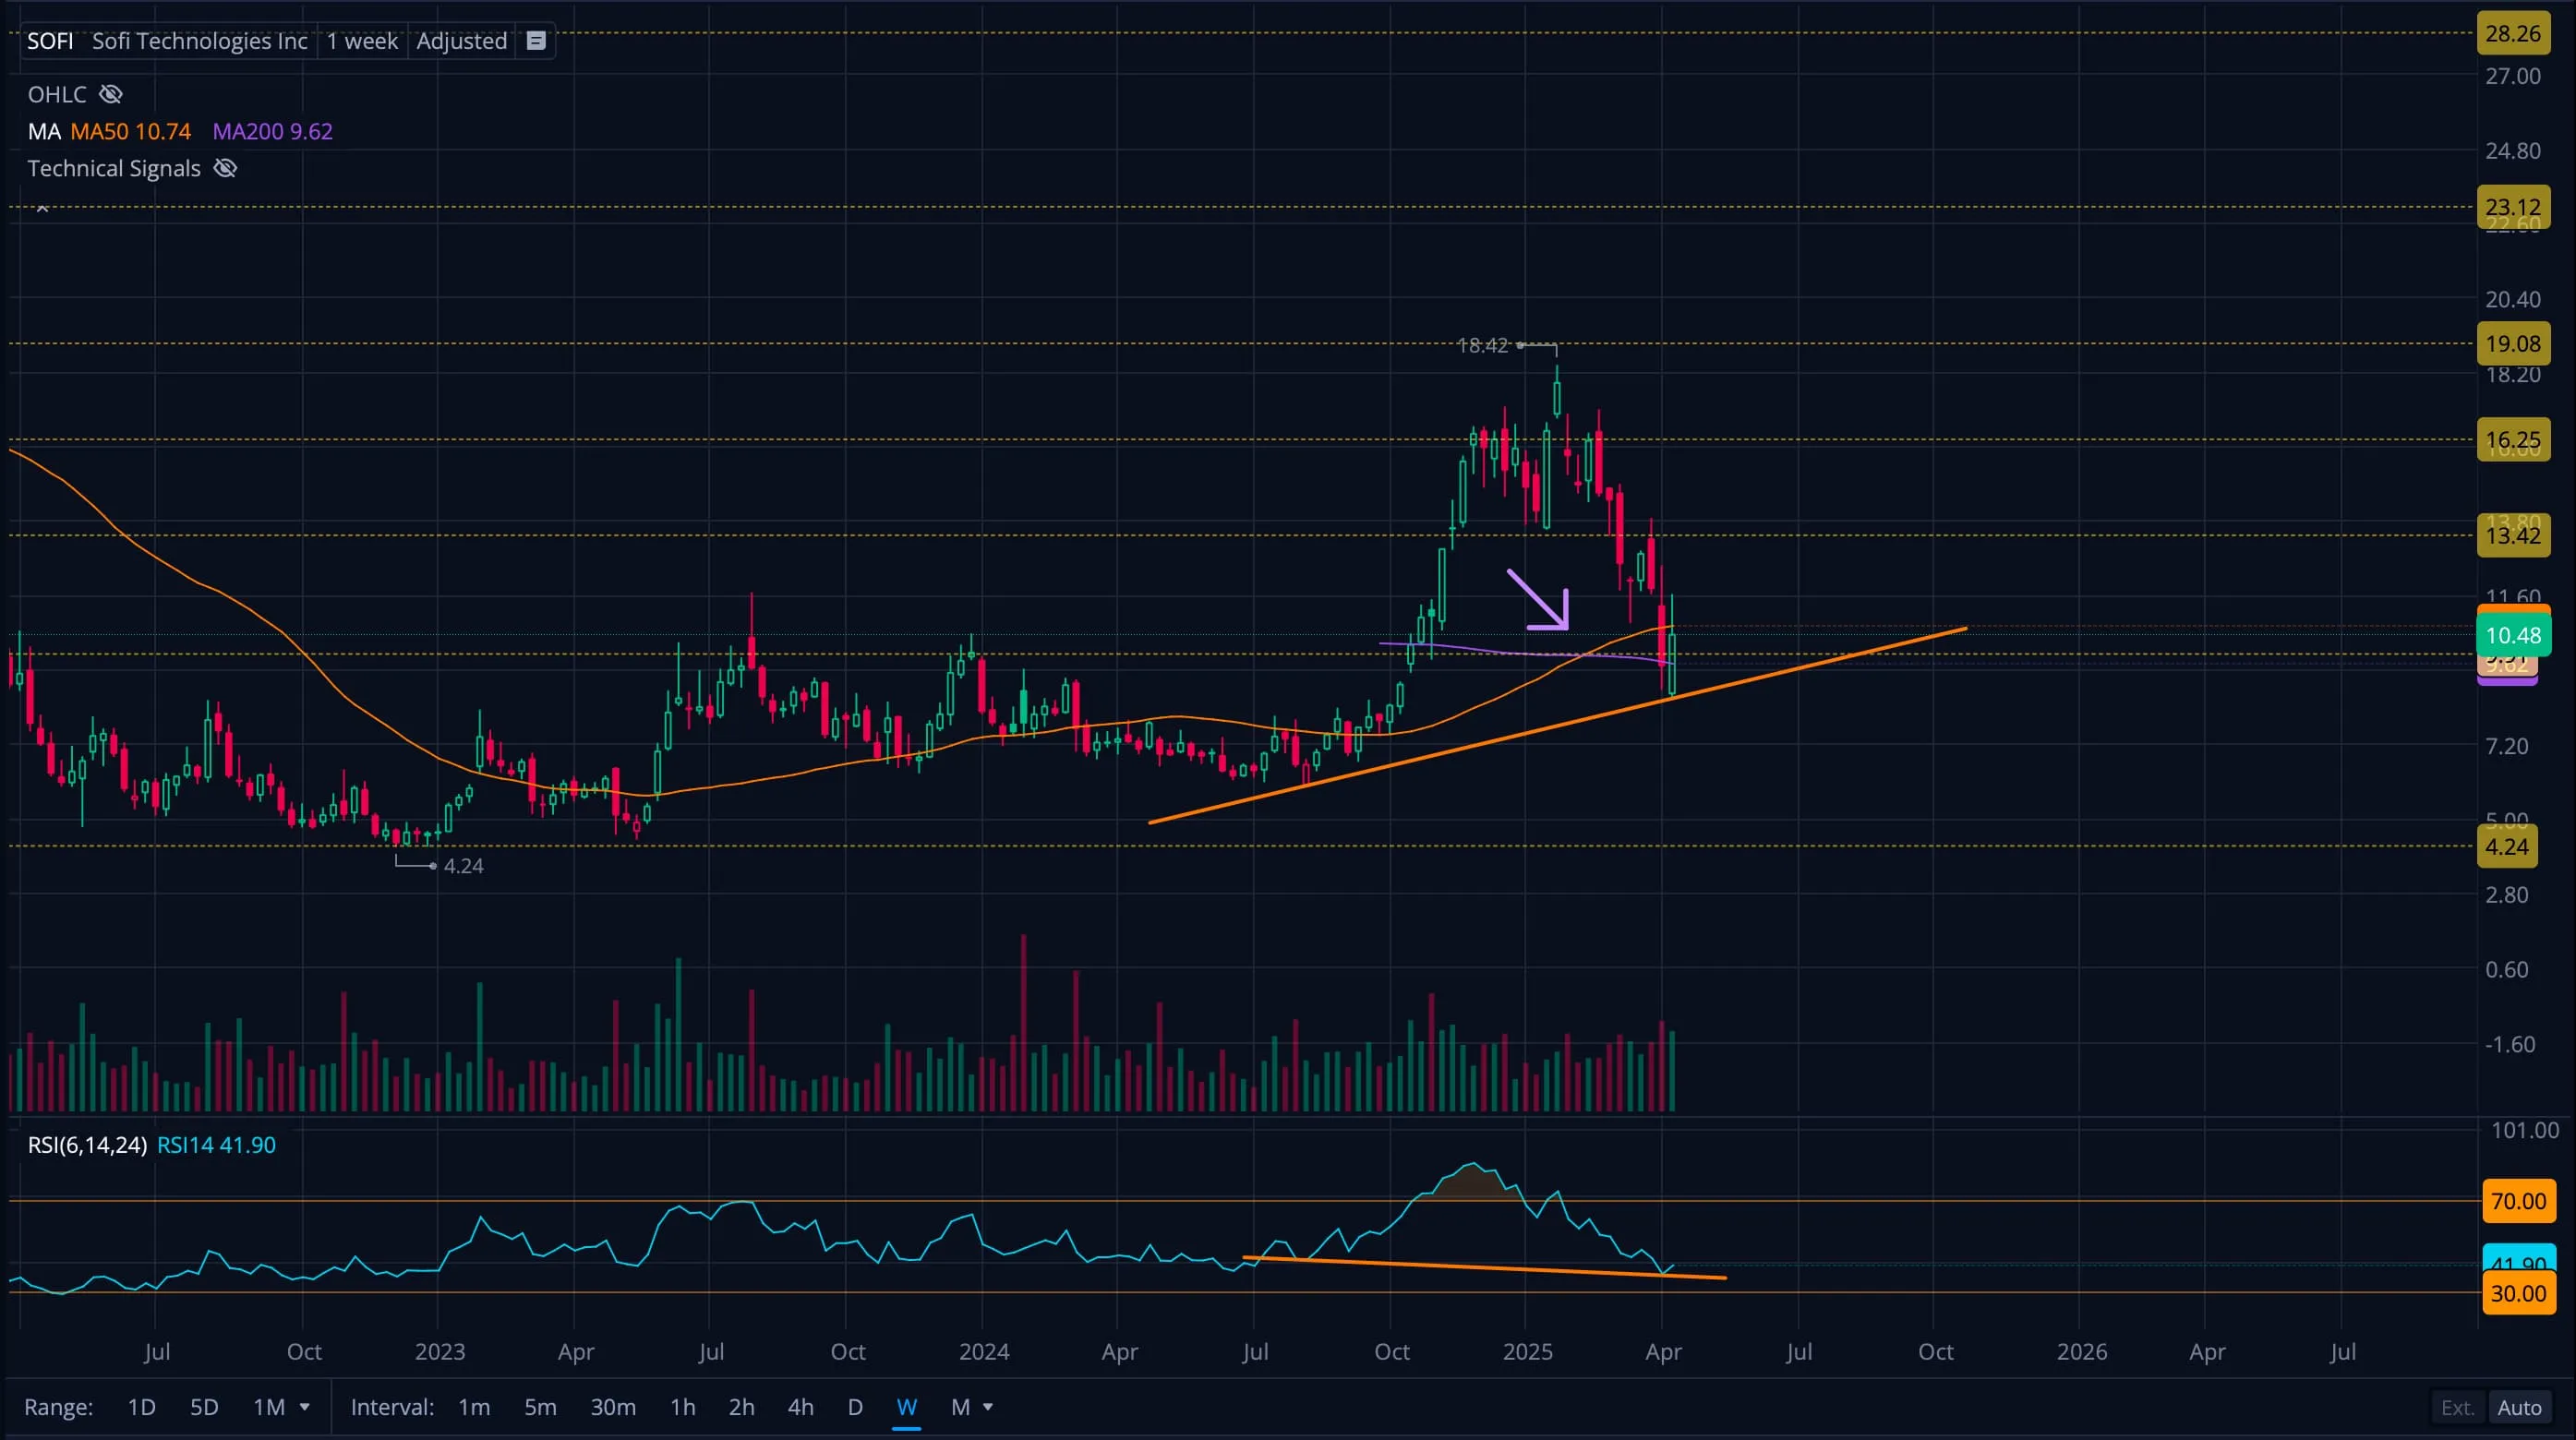
$SOFI - Weekly Chart
Date Analyzed: 04/10/2025
SOFI formed a golden cross, retraced to Fibonacci support, and showed early bullish RSI divergence near the 200-week moving average.